



AppLovin stock is under renewed pressure on Friday, trading at $271.72 as of 09:46 ET, down 3.41% against Thursday’s close of $281.31. The daily and hourly charts show a stock locked in a downtrend. Only the 15-minute chart hints at a short-lived pause in selling momentum.
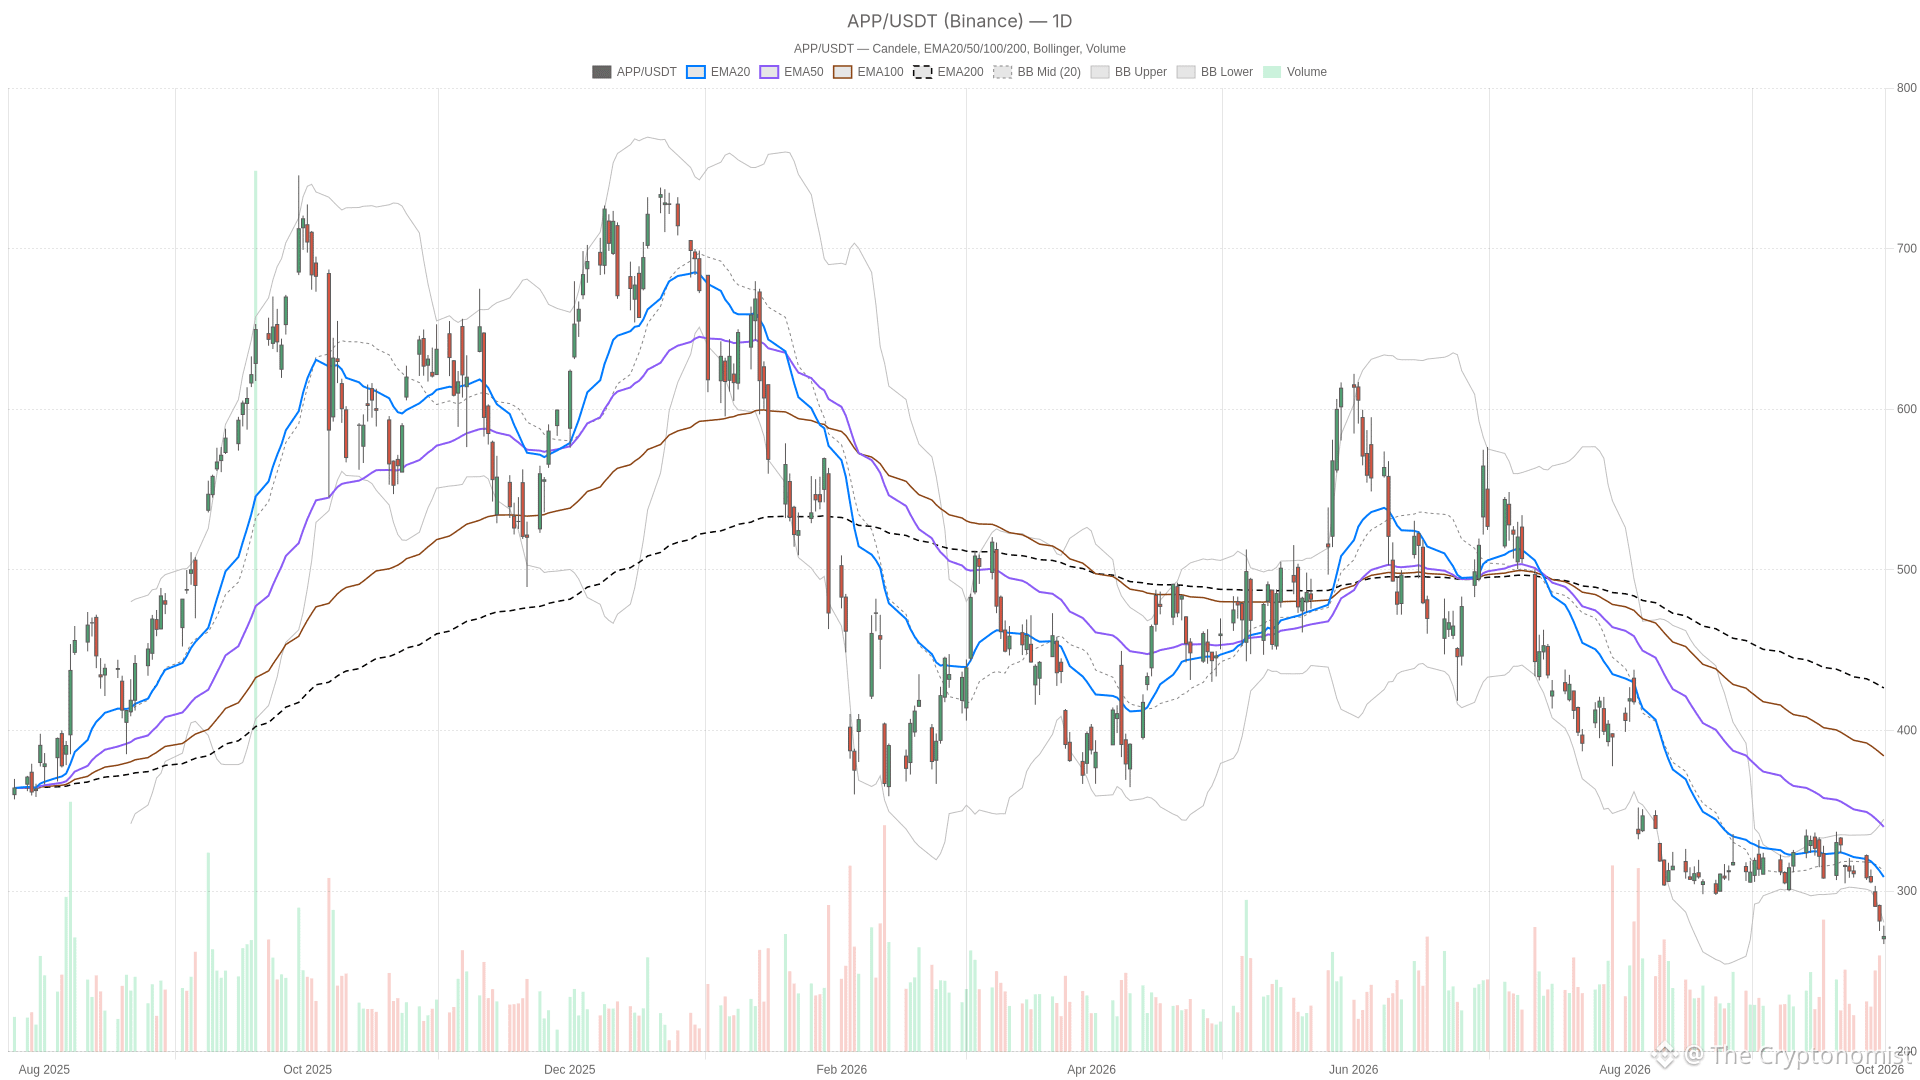 APP — daily chart with candlesticks, EMA20/EMA50 and volume.
Key takeaways
AppLovin stock was trading at $271.72 as of 09:46 ET on Friday, down 3.41%, below the daily S1 support at $273.78.
Daily RSI14 at 29.28 and hourly RSI14 at 20.34 both sit firmly in oversold territory, with MACD still negative on both timeframes.
Price trades below the daily lower Bollinger band at $280.51 and beneath every key EMA across daily and hourly charts.
The 15-minute MACD histogram turned slightly positive at 0.26, hinting at short-term seller exhaustion without signaling a broader reversal.
Investing.com reported before Friday’s open that a court denied AppLovin’s request against Unity, adding to selling pressure.
Daily Chart: AppLovin Stock Deep in Bearish Territory
AppLovin stock’s daily trend is unambiguously bearish. Price at $271.72 sits below the 20-session EMA at $308.68. That average sits below the 50-session EMA at $339.94, which in turn sits below the 200-session EMA at $441.88. The result is a fully bearish stack, with every short-term average beneath the next longer one.
Momentum readings confirm the picture. Daily RSI14 stands at 29.28, in oversold territory. Meanwhile, the MACD line at -12.73 remains below its signal at -9.72, producing a negative histogram of -3.01. The daily ATR14 reads 15.64, underscoring the depth of the current bearish momentum.
Friday’s session opened at $270.24 and swung between a low of $266.95 and a high of $278.43. That range reflects a stock pushed lower from the opening bell, testing fresh intraday lows before stabilizing somewhat.
Volatility backs this up. The daily ATR14 reads 15.64, a meaningful swing for a stock trading in the $270s. Price is currently below the lower Bollinger band at $280.51. The mid-band sits at $312.64 and the upper band at $344.77. Trading outside the lower band signals an extended, stretched move rather than orderly consolidation.
On the pivot structure, price has broken below the daily S1 at $273.78. It sits well under the pivot point at $282.66 and nowhere near the R1 resistance at $290.19. In practice, sellers have already taken out the first layer of support expected to slow a decline.
Hourly Momentum Confirms the Downtrend
The hourly chart reinforces the bearish bias without offering any counterweight. Price at $271.72 remains below the hourly EMA20 at $289.29. That average sits below the EMA50 at $300.73, which in turn sits below the EMA200 at $316.23. The result is another clean bearish stack.
Meanwhile, RSI14 on this timeframe reads 20.34, even more oversold than the daily reading. The MACD line at -8.55 sits below its signal at -7.36, keeping the histogram negative at -1.19. Therefore, the hourly chart does not diverge from the daily trend. It reinforces it.
Price also trades below the hourly pivot at $281.83 and below the hourly S1 at $280.46. That places it beneath every short-term reference point on this timeframe. The hourly Bollinger setup shows price between the mid-band at $291.79 and the lower band at $268.9, closer to the lower edge. In other words, there is still a little room before the hourly chart becomes as stretched as the daily one. However, the direction of travel is the same.
15-Minute View: Execution Context Shows a Subtle Shift
On the 15-minute chart, the structure remains bearish on the surface. Price sits below the EMA20 at $281.06 and the EMA50 at $287.09. It also remains below the EMA200 at $303.12 and the lower Bollinger band at $273.48. The mid-band sits at $279.38. RSI14 at 23.95 stays in oversold territory, consistent with the other timeframes.
However, there is one small wrinkle worth noting. The 15-minute MACD line at -2.25 is now slightly above its signal at -2.52. That produces a positive histogram of 0.26. It is a modest, short-term signal only. It should not be confused with a change in the broader trend. At most, it suggests sellers may be pausing at the most granular level, not that buyers have taken control.
What’s Behind the Move
News flow around AppLovin has been heavy over the past day. On Thursday, a Yahoo Finance report said AppLovin fell 3% after Wells Fargo called the Pixel install spike a “false start.” That metric had been used by investors to track the company’s e-commerce progress.
The same day, an Investing.com report noted that options flow showed puts outnumbering calls. AppLovin shares slipped 2.73% in that session. A Motley Fool comparison piece published Thursday also noted that AppLovin missed Q2 estimates. Still, it highlighted the company’s strong margins and expanding AI advertising platform. The piece contrasted AppLovin with The Trade Desk, which it said posted its slowest revenue growth in years.
Separately, a Yahoo Finance report published Thursday said AppLovin had filed a lawsuit against Unity Technologies. The complaint alleges unauthorized data collection during MAX ad auctions. It focuses on Unity’s use of bidding data from AppLovin’s MAX platform. The filing claims the data was gathered without proper consent.
Then, in a report published before Friday’s open, Investing.com said AppLovin shares fell after a court denied the company’s request against Unity. That ruling appears tied to Friday’s early weakness, based on how the outlet framed it.
Bullish Scenario
A bullish case for AppLovin stock would need price to first reclaim the daily S1 at $273.78. From there, it would need to clear the daily pivot at $282.66. Only then could a meaningful test of the R1 resistance at $290.19 come into play.
Notably, daily RSI14 is already at 29.28 and hourly RSI14 at 20.34. A short-term bounce from oversold conditions is therefore not out of the question. The slightly positive 15-minute MACD histogram would need to be echoed on the hourly timeframe. That histogram currently remains negative at -1.19. Without hourly confirmation, any bounce would likely stay contained well below the daily EMA20 at $308.68.
Bearish Scenario
The bearish case, in contrast, is simply a continuation of what is already in motion. Price sits below the daily lower Bollinger band at $280.51. It also sits below every EMA on all three timeframes. Further downside would be the path of least resistance unless buyers step in decisively.
A break below the daily low of $266.95 would open the door to testing levels not yet referenced by the current pivot structure. The bearish case would be invalidated only if price reclaims the daily pivot at $282.66 and holds above it. That would also require a shift in the hourly MACD histogram back above zero.
Closing Take
Overall, AppLovin stock remains positioned below every key daily and hourly level. It sits below the daily EMA20 at $308.68 and below the daily lower Bollinger band at $280.51. It is also below the daily pivot S1 at $273.78.
Momentum across the daily and hourly timeframes is firmly negative. Volatility, with a daily ATR14 of 15.64, remains elevated. The only mild counterpoint comes from the 15-minute MACD. A slightly positive histogram there hints at short-term exhaustion among sellers. Whether that translates into anything more than a brief pause remains uncertain. With the session still open, the next few hours of trading will be telling. Price action against the $273.78 and $282.66 levels will likely say more than any single indicator can on its own.
FAQ
What are the key support and resistance levels for AppLovin stock?
AppLovin stock faces immediate support at the daily S1 of $273.78, which it has already broken below. The next reference is the session low of $266.95. On the upside, resistance stands at the daily pivot of $282.66, followed by the R1 at $290.19. The daily EMA20 at $308.68 represents a deeper level that would need to be reclaimed for any durable recovery.
Is AppLovin stock oversold on a technical basis?
Yes, across multiple timeframes. The daily RSI14 reads 29.28, and the hourly RSI14 is even lower at 20.34. Both are in oversold territory. However, oversold conditions in a downtrend can persist, and do not by themselves signal a reversal.
What company-specific news has been reported around AppLovin this week?
Several items: a Yahoo Finance report said Wells Fargo called the Pixel install spike a “false start.” Investing.com noted bearish options flow. AppLovin also filed a lawsuit against Unity Technologies over alleged unauthorized data collection. Investing.com then reported before Friday’s open that a court denied AppLovin’s request against Unity. A Motley Fool piece noted the company missed Q2 estimates but highlighted strong margins and an expanding AI advertising platform.
What would need to happen for a bullish reversal in AppLovin stock?
A bullish reversal would require price to reclaim the daily S1 at $273.78 first, then clear the daily pivot at $282.66. The hourly MACD histogram, currently negative at -1.19, would also need to turn positive to confirm buying momentum. Without these signals, any bounce would likely remain short-lived and contained below the daily EMA20 at $308.68.
Disclaimer: This article is for informational purposes only and does not constitute financial advice, an investment recommendation, or a solicitation to buy or sell any financial instrument or cryptocurrency. The analysis provided is not indicative of future results. Investing in crypto assets and financial markets carries a high risk of capital loss. Always do your own research (DYOR) and consult a qualified financial advisor before making any decision.
Article produced with the assistance of artificial intelligence and reviewed by the editorial team.