#ETH: $3,000 could become a turning point
On the daily chart, ETH/USDT is forming an upward impulse after a decline.
However, the price is now approaching a zone that previously acted as a supply cluster.
Therefore, further growth does not necessarily mean a continuation of the trend: the market may first take liquidity above local highs and then move into a correction.
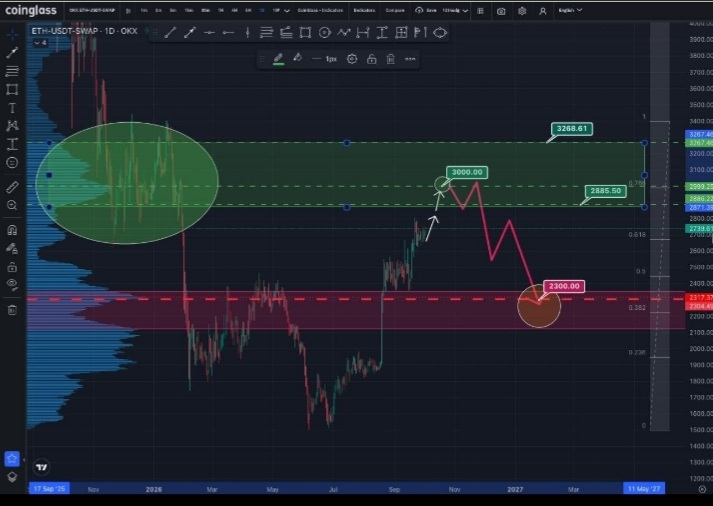
The main resistance zone is $3,000–3,268.
Within it runs the Fibonacci 0.786 level around $2,999, almost coinciding with the $3,000 mark.
The volume profile shows high activity in this range, indicating a concentration of positions and seller pressure.
The base trajectory: first, ETH tests $3,000, and if momentum holds, it may push toward $3,100–3,270.
After that, the probability of profit-taking and the market entering a correction phase increases.
The target for the decline is around $2,300.
Several factors converge here: the red support zone $2,100–2,317, high horizontal volume, and the Fibonacci 0.382 level around $2,304. The $2,300 area becomes key for buyer reaction.
Bearish scenario:
$2,700–2,800 → $3,000 → $3,100–3,270 → reversal → $2,300.
If ETH fails to hold above $3,000–3,268, the current impulse may turn out to be a distribution before correction.
Losing $2,300 will worsen the structure and could open the way to the lower part of the red range—around $2,100.
The macroeconomic background remains a risk factor. Expectations of Fed policy changes support demand for risk assets, but markets shifting to Risk-Off mode can accelerate profit-taking.
After strong growth, entering the supply zone increases the risk of a sharp downward move.
Therefore, the key question now is what will happen after testing $3,000. Holding above $3,268 will change the scenario.
Failure to rise in the $3,000–3,268 zone will increase the likelihood of a correction to $2,300.
Price reaction in these zones will determine ETH’s next major move.
If sellers intensify pressure, the correction may develop faster than currently expected.