
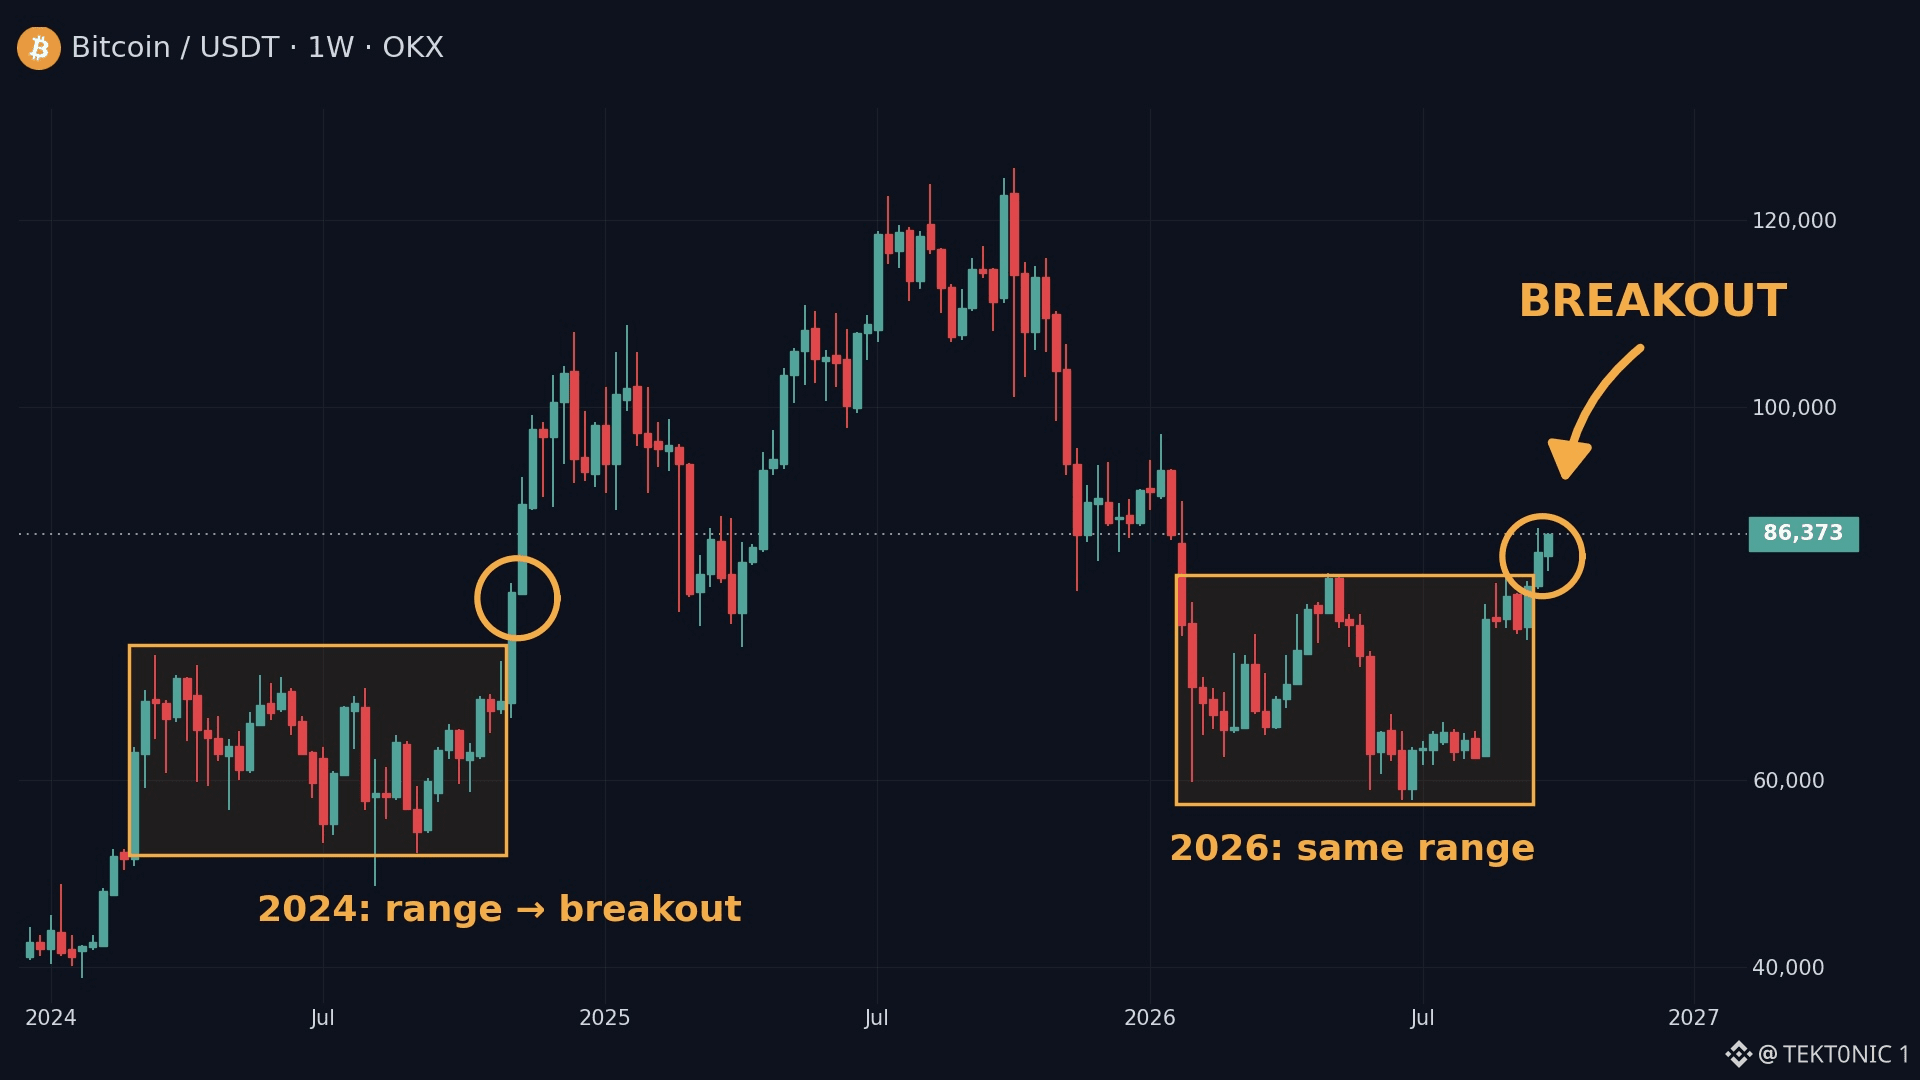
$BTC has broken out of the range that held it for about seven months. on the weekly chart, price is back through $86,373 after spending 2026 between the low-$60,000s and the mid-$80,000s. The same kind of range showed up in 2024. Once that one broke, Bitcoin reached $100,000 within about five weeks. That is the comparison the chart is drawing. this break is not the same market. In 2024 the range sat under a new high. This one sits under the 2025 peak near $126,000, after Q1 and Q2 losses and a 42.6% Q3. Spot ETFs took in about $6.3 billion last quarter. Kalshi still prices $100,000 by year-end near 40%. now the focus shifts to whether $86,000 holds. a clean retest of that former ceiling would give traders more confirmation that the range is actually broken. A slip back under it puts price inside the seven-month band again. breakout first. confirmation next on $BTC chart. #BTC Price Analysis# #Bitcoin Price Prediction: What is Bitcoins next move?# $ETH #Bullish


نشر
إخلاء مسؤولية: يتضمن آراء جهات خارجية. لا تُعدّ نصيحة. يُمكن استخدام Binance AI دون أي ضمان. اطلع على الشروط والأحكام.