



Accenture stock surged 15.78% on Thursday, closing at $212.30 after a strong fiscal Q4 earnings report. The daily chart now sits above key moving averages. However, conflicting signals across timeframes add nuance for the sessions ahead.
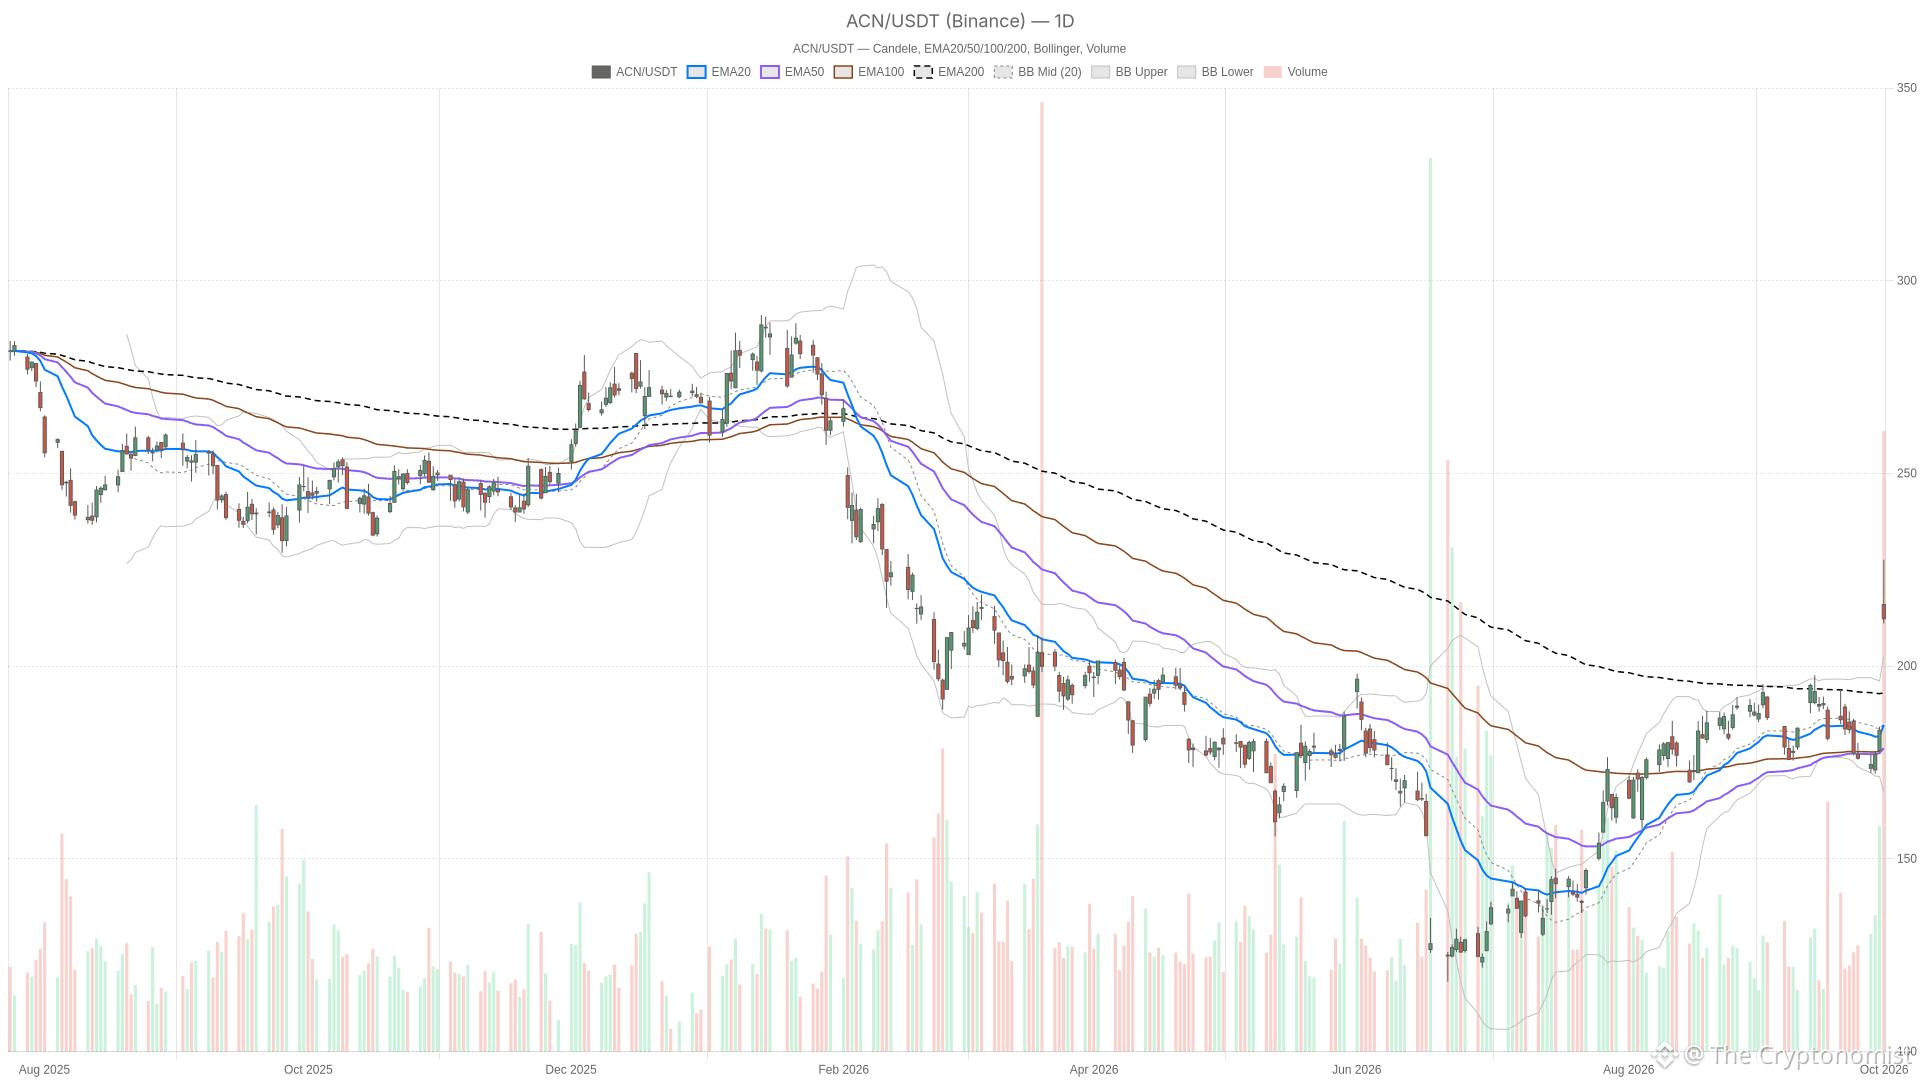 ACN — daily chart with candlesticks, EMA20/EMA50 and volume.
Key takeaways
Accenture stock closed at $212.30 on Thursday, up 15.78%, after reporting fiscal Q4 earnings that beat revenue and bookings expectations.
The daily RSI14 hit 70, right at overbought territory, while the MACD remains bullish with a positive histogram of 0.77.
Price closed above the daily upper Bollinger band ($202.54) and above the 200-session EMA ($195.01), confirming a genuine breakout.
The hourly chart shows textbook bullish EMA alignment, but the 15-minute chart reveals short-term fatigue with a negative MACD histogram.
Daily ATR14 expanded to 9.58, signaling wider swings ahead; next-session pivot support sits at S1 ($206.35) and resistance at R1 ($222.94).
Given the magnitude of the move, volume stands out: the session traded 28,979,200 shares. The stock opened at $215.98, hit a high of $227.63, and dipped to $211.04 before closing at $212.30. In other words, Accenture stock surrendered ground intraday. The open-to-close change landed at -1.70%, even as the close-to-close gain reached 15.78%. That gap between the opening spike and the final print signals the move was not a one-way street.
Daily Chart: Accenture Stock Breaks Above Its Upper Band
The close of $212.30 sits above all three key daily EMAs. Price is above the 20-session EMA at $184.75, the 50-session EMA at $178.78, and the 200-session EMA at $195.01. However, this is not a classic bullish stack. The 200-session average sits above the 20-session line, which in turn sits above the 50-session average. Price trading above all three points to a sharp late-stage repricing rather than a smoothly built uptrend.
Momentum and Volatility Signals
Momentum confirms the strength of the move. The daily RSI14 reads 70, right at overbought territory. The MACD line at 2.56 sits above its signal line at 1.78, with a positive histogram of 0.77. That is a clean bullish momentum reading, even if the RSI warns the move has stretched quickly.
Meanwhile, the daily Bollinger bands reinforce the breakout. Price at $212.30 trades above the upper band at $202.54. The mid-band sits at $185.01 and the lower band at $167.48. A close outside the upper band after a gain of this size reflects a genuine breakout, not a gentle drift higher.
Volatility has expanded accordingly. The daily ATR14 stands at 9.58, consistent with Thursday’s wide high-to-low range. For the next session, the daily pivot sits at $216.99, with first resistance (R1) at $222.94 and first support (S1) at $206.35. Those levels become the reference points once trading resumes.
Hourly Trend Confirms the Breakout in Accenture Stock
The hourly chart offers a cleaner bullish picture for Accenture stock. Price at $212.54 sits above the 20-hour EMA at $198.04. That 20-hour line sits above the 50-hour EMA at $189.08. In turn, the 50-hour line sits above the 200-hour EMA at $184.31. This textbook bullish alignment reinforces the idea that the breakout has real follow-through at the intraday level.
The hourly RSI14 reads 70.43, again flirting with overbought. The MACD line at 10.15 sits comfortably above its signal at 7.21, with a histogram of 2.94. Momentum here is unambiguous.
The hourly Bollinger bands show a mid-band of $192.46 and an upper band of $228.71. The lower band sits at $156.21. Price trades inside that range rather than pressing the extremes. The hourly ATR14 at 4.96 confirms volatility has picked up but remains contained relative to the daily range.
For the next session, the hourly pivot sits at $213.39, with R1 at $215.75 and S1 at $210.18. Overall, the hourly timeframe confirms the daily bias rather than complicating it.
15-Minute Chart Signals Short-Term Fatigue for ACN
At the execution level, the picture softens. The 15-minute EMAs remain aligned bullishly. The 20-period line at $213.20 sits above the 50-period line at $203.67. That sits above the 200-period line at $189.28. However, price at $212.54 trades just under the 20-period average. This signals short-term momentum has cooled after the initial surge.
That cooling shows up elsewhere. The 15-minute RSI14 has retreated to a neutral 53.89, well off the overbought readings on higher timeframes. The MACD line at 3.33 now sits below its signal line at 4.85, producing a negative histogram of -1.52.
At the same time, price at $212.54 trades below the 15-minute lower Bollinger band of $213.23. The mid-band sits at $215.75 and the upper band at $218.27. That combination points to a short-term pullback within the broader breakout, not a reversal of the higher-timeframe trend.
The 15-minute ATR14 sits at 2.58. The pivot for the next session comes in at $212.73, with R1 at $214.42 and S1 at $210.85.
Therefore, the conflict across timeframes is clear. The daily and hourly charts both confirm a strong bullish move for Accenture stock. Meanwhile, the 15-minute chart shows near-term fatigue. That is a complication for timing, not a contradiction of the broader thesis.
What Drove the Move in Accenture Stock
A Yahoo Finance Q4 earnings highlights report, published during Thursday’s session, outlined the key numbers. Accenture beat Q4 revenue guidance with 7% local-currency growth. It posted a record $12.8 billion in managed services bookings. It also guided fiscal 2027 revenue growth of 3% to 6% in local currency. An Investing.com piece, also published during the session, covered the same earnings release and its implications for upcoming catalysts.
After Thursday’s close, a Motley Fool transcript of the earnings call added that the company’s AI-related workforce had doubled ahead of schedule.
Separately, a Yahoo Finance report published after Thursday’s close noted Accenture climbed 15.78% to close at $212.30. The gain extended a winning streak to a third straight day, as investors cheered the earnings beat and bookings growth. A Seeking Alpha report, also published after the close, said shares surged 16% following the results beat on revenue and bookings.
Bullish Scenario for Accenture Stock
The bullish case rests on the daily and hourly alignment holding together. If Accenture stock can hold above the daily 200-session EMA at $195.01, the breakout stays intact. Clearing the daily pivot resistance at R1 ($222.94) in the sessions ahead would add credibility.
Continued strength in managed services bookings would support that narrative. The fiscal 2027 guidance range of 3% to 6% local-currency growth provides a fundamental anchor. Meanwhile, the hourly chart’s clean bullish stacking reinforces the technical case.
Bearish Scenario and What Would Invalidate It
On the other hand, the overbought RSI readings leave room for a cooling-off period. The daily RSI14 at 70 and hourly RSI14 at 70.43 both sit at stretched levels.
A daily close back below the pivot support at S1 ($206.35) would weaken the bullish case meaningfully. A break of the hourly support at S1 ($210.18) would do the same. Should the hourly MACD histogram flip negative, it would mirror what already happened on the 15-minute chart. That would be an early signal the breakout is losing steam rather than consolidating.
In contrast, the 15-minute chart already hints at this kind of short-term exhaustion. Its negative MACD histogram and the breach below the lower Bollinger band both point to near-term fatigue. Whether that extends into the daily and hourly timeframes is the key question for the sessions ahead.
Overall, Accenture stock enters the next session with a bullish daily and hourly trend. Momentum readings remain positive even if stretched. Volatility has expanded sharply, with the daily ATR14 at 9.58 signaling wider swings than before earnings. Meanwhile, the short-term chart’s pullback is a reminder that after a 15.78% move, some give-back is normal. Positioning around the pivot levels on each timeframe looks like the more useful frame for navigating the uncertainty that typically follows a gap of this size.
FAQ
What drove Accenture stock’s 15.78% surge on Thursday?
The surge followed a strong fiscal Q4 earnings report. Accenture beat revenue guidance with 7% local-currency growth, posted a record $12.8 billion in managed services bookings, and guided fiscal 2027 revenue growth of 3% to 6% in local currency.
Is Accenture stock overbought after the surge?
The daily RSI14 reads 70, right at overbought territory, and the hourly RSI14 reads 70.43. Both suggest the move has stretched quickly, though momentum indicators remain bullish overall.
What are the key levels to watch for Accenture stock in the next session?
The daily pivot sits at $216.99, with resistance at R1 ($222.94) and support at S1 ($206.35). On the hourly chart, the pivot is at $213.39, with R1 at $215.75 and S1 at $210.18.
Disclaimer: This article is for informational purposes only and does not constitute financial advice, an investment recommendation, or a solicitation to buy or sell any financial instrument or cryptocurrency. The analysis provided is not indicative of future results. Investing in crypto assets and financial markets carries a high risk of capital loss. Always do your own research (DYOR) and consult a qualified financial advisor before making any decision.
Article produced with the assistance of artificial intelligence and reviewed by the editorial team.