


Liquidia stock cratered 57.19% on Wednesday, closing at $30.26 versus $70.69 on 2026-09-29, after a federal court ruled against its YUTREPIA lung drug in a patent dispute with United Therapeutics. Volume surged to 22,770,901 shares, reshaping the technical picture across every timeframe.
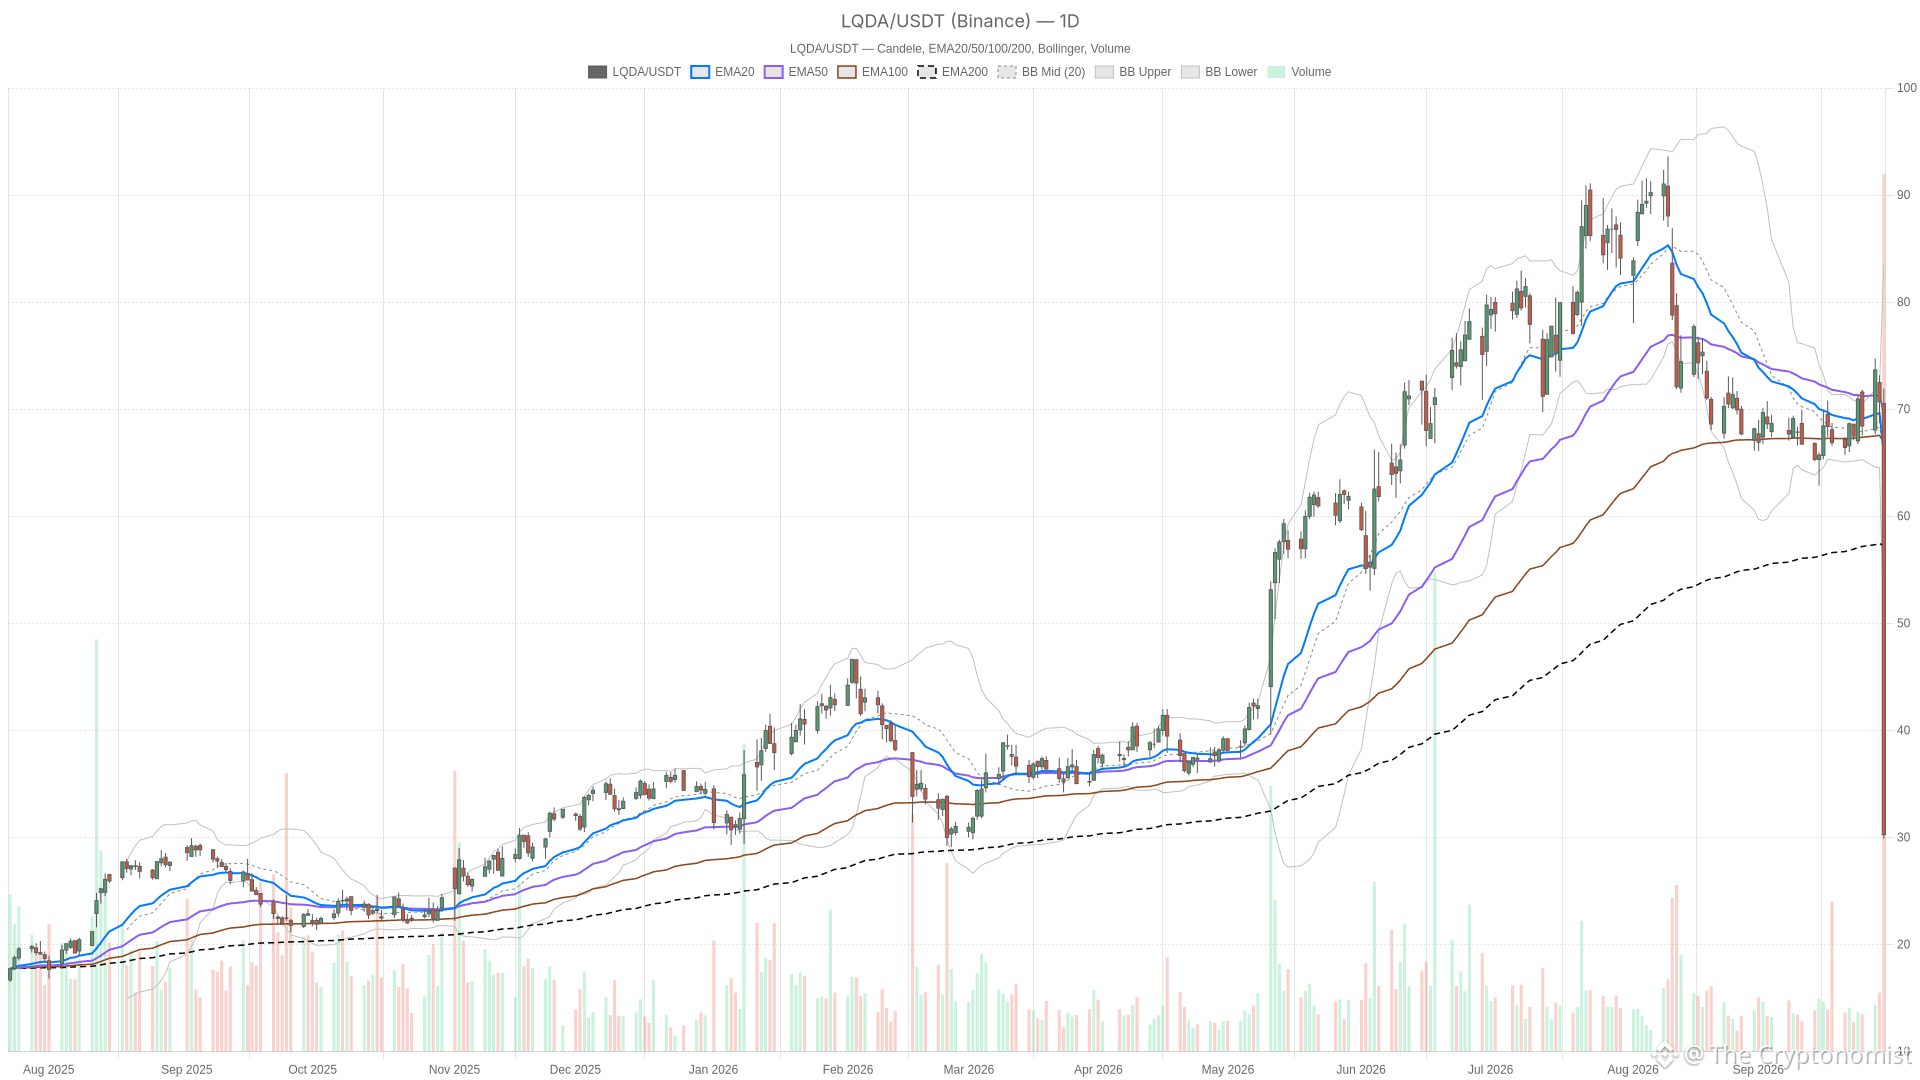 LQDA — daily chart with candlesticks, EMA20/EMA50 and volume.
Key takeaways
Liquidia stock plunged 57.19% on Wednesday, closing at $30.26 from a prior close of $70.69, with volume reaching 22,770,901 shares.
The daily RSI14 collapsed to 20.23, deep in oversold territory, while price closed well below the lower Bollinger Band at $49.45.
Price sits beneath all major EMAs across daily, hourly, and 15-minute timeframes, confirming a structural bearish breakdown.
After the close, BTIG cut its rating on Liquidia stock to neutral, tied directly to the patent ruling.
Hourly RSI14 at 18.38 and 15-minute RSI14 at 17.47 signal extreme momentum exhaustion, raising short-term mean-reversion risk.
What Happened: Liquidia Stock and the YUTREPIA Ruling
During Wednesday’s session, a Yahoo Finance report said the US District Court for the District of Delaware found Liquidia’s lung drug infringes a key United Therapeutics patent. It described the ruling as a major blow to the treatment’s commercial outlook. Liquidia CEO Roger Jeffs said the company disagrees with the decision and will “pursue all available appellate options.”
Separately, an Investing.com report published during the session noted that options activity surged after the ruling sank the stock 48%. The spike underlined how abruptly positioning shifted intraday.
After the close, a Seeking Alpha report said Liquidia plunged 57% on the litigation update, broadly in line with the final session change. Also after the close, an Investing.com report said BTIG cut its rating on Liquidia stock to neutral following the patent ruling. Because the rating action came after Wednesday’s close, it is a post-session analyst reaction — not something that shaped the day’s trading.
Daily Trend: Structural Damage Is Severe
Wednesday’s daily candle tells the story. It opened at $70.54, hit a high of $71.93, plunged to a low of $29.86, and closed at $30.26. The 14-day ATR of 6.38 confirms volatility has expanded well beyond typical conditions.
Price now trades beneath all three major daily EMAs. The 50-session EMA at $69.67 sits above the 20-session EMA at $65.88. In turn, that sits above the 200-session EMA at $56.91. That ordering is not a clean bearish stack. However, with price at $30.26 sitting far below all three lines, the stock has detached sharply from its recent trend structure.
Momentum backs this up. The daily RSI14 has collapsed to 20.23, deep into oversold territory. Meanwhile, the MACD line sits at -3.86 against a signal line of -2.15, leaving a negative histogram of -1.71. Price has also closed well below the lower Bollinger Band at $49.45. The midline sits at $66.48 and the upper band at $83.52.
Notably, a close this far outside the lower band is unusual. It points to a capitulation-style move rather than an orderly pullback. On the daily pivot grid, price is wedged between the pivot point at $44.02 and first support at $16.10. Resistance at $58.17 remains well out of reach.
Hourly Timeframe Confirms the Bearish Read
The 1-hour chart reinforces the daily picture. Price at $30.19 sits beneath the 20-hour EMA at $58.00. That sits beneath the 50-hour EMA at $64.05, which in turn sits beneath the 200-hour EMA at $69.87. This is a textbook bearish alignment, with every moving average stacked above price in descending order of recency.
Hourly RSI14 at 18.38 is even more stretched than the daily reading. The MACD line at -8.03 versus a signal of -3.39 produces a histogram of -4.65. That is a wider negative gap than on the daily chart. Therefore, the shorter-term trend confirms the daily bias with greater force.
The hourly pivot point sits at $30.95, with resistance at $32.04 and support at $29.10. Price is currently pinned just under the pivot.
15-Minute Execution Context
On the 15-minute chart, the same bearish ordering holds. Price at $30.19 sits below the 20-period EMA at $47.36. That sits below the 50-period EMA at $58.53, which in turn sits below the 200-period EMA at $65.94.
The 15-minute RSI14 at 17.47 confirms extreme oversold conditions. The MACD histogram of -2.27, with the line at -10.43 and signal at -8.16, shows sellers pressing lower into the close. The 15-minute pivot point stands at $30.41, with resistance at $30.96 and support at $29.64. Price sits just under the pivot, within range of that nearby support.
For short-term positioning, this matters mainly as a map of reaction levels. It is not a trend signal in its own right. At this timeframe, the chart simply confirms that sellers remained in control into the final quarter-hour of the session.
Bullish Scenario: What Would Support a Bounce
Still, a near-term bounce is not out of the question. Oversold readings are stretched across all three timeframes. For that scenario to gain traction, price would first need to reclaim the 15-minute pivot at $30.41. Then it would need to retake the hourly pivot at $30.95. A sustained move above hourly resistance at $32.04 would be the first real sign that immediate selling pressure has eased.
On the news side, any update on appellate options could shift sentiment if the market reads it as improving the company’s odds. However, until price reclaims meaningful daily-chart levels like the pivot at $44.02, any bounce faces a credibility test. It would likely be seen as a relief move within a broken trend — not a reversal.
Bearish Scenario: What Would Confirm Further Downside
On the other hand, the bearish case remains intact as long as price stays capped below the hourly and daily EMAs. A break below hourly support at $29.10 would be the first warning. A subsequent failure to hold the 15-minute support at $29.64 would suggest sellers are not done.
Further out, a slide toward daily first support at $16.10 would confirm a deeper story. Wednesday’s move would mark the start of a deeper repricing, not an isolated shock. The post-close BTIG downgrade to neutral adds a layer of analyst caution. Tied directly to the patent ruling, this would need to reverse before the bullish case could be taken seriously.
Similarly, widening negative MACD histograms on the daily and hourly charts would invalidate any bullish attempt. They would confirm trend continuation to the downside.
Liquidia Stock: Technical Outlook After the 57% Plunge
Overall, Liquidia stock enters the new session with a structurally broken daily chart. The hourly chart confirms the bearish trend with cleanly stacked EMAs. The 15-minute chart is still searching for footing near session lows.
At the same time, RSI readings in the high teens and low twenties across every timeframe carry a clear message. Sharp counter-trend bounces are a real possibility at any point. Elevated options activity noted in Wednesday’s session adds to the sense that positioning remains unsettled.
Given the scale of Wednesday’s move, the pending appellate process, and the fresh analyst rating cut, volatility is likely to stay elevated. Any near-term technical signal should be treated with caution until the litigation picture becomes clearer.
FAQ
What caused Liquidia stock to drop 57% on Wednesday?
A federal court ruling in the YUTREPIA patent dispute found Liquidia’s lung drug infringes a key United Therapeutics patent. The decision dealt a major blow to the treatment’s commercial outlook. The ruling triggered the sharpest single-session decline on record for the stock.
Where does Liquidia stock stand technically after the sell-off?
The stock trades below all major daily, hourly, and 15-minute EMAs. The daily RSI14 collapsed to 20.23, deep in oversold territory, and price closed well below the lower Bollinger Band at $49.45. The MACD histogram on every timeframe remains firmly negative.
What are the key levels to watch for Liquidia stock?
On the downside, hourly support sits at $29.10 and daily first support at $16.10. For a bounce, price needs to reclaim the 15-minute pivot at $30.41 and the hourly pivot at $30.95. A sustained move above hourly resistance at $32.04 would be the first sign of easing selling pressure.
Did any analysts change their rating on Liquidia stock after the ruling?
Yes. After Wednesday’s close, BTIG cut its rating on Liquidia stock to neutral, tying the downgrade directly to the patent ruling. This reflects post-session analyst caution rather than an intraday driver of the sell-off.
Disclaimer: This article is for informational purposes only and does not constitute financial advice, an investment recommendation, or a solicitation to buy or sell any financial instrument or cryptocurrency. The analysis provided is not indicative of future results. Investing in crypto assets and financial markets carries a high risk of capital loss. Always do your own research (DYOR) and consult a qualified financial advisor before making any decision.
Article produced with the assistance of artificial intelligence and reviewed by the editorial team.