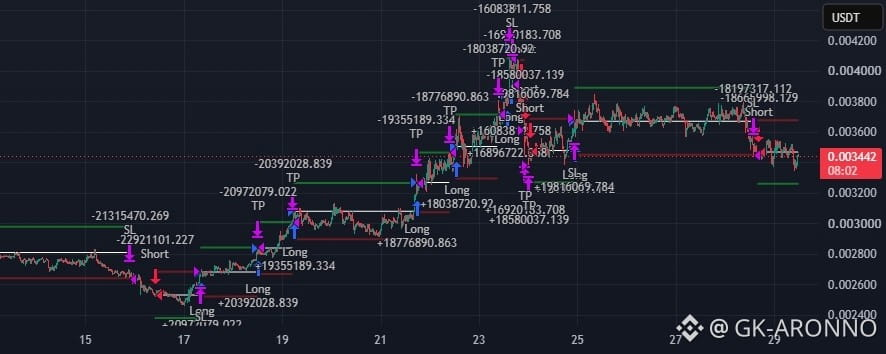

Popular belief: with a fixed 6% stop, no single loss can be much bigger than 6%. The recent 1000BONKUSDT.P trades on the chart, plus one older stop, show where that breaks.
The strategy (Contrarian Crossover) runs on the 15m chart. It takes the same exhaustion signal as Adaptive Mean Reversion but trades it the other way, joining the stretched move, with an equal fixed take-profit and stop-loss of 6%.
What did the last trades look like?
On 21-23 Sep the strategy closed a run of longs at take-profit, each close to +5.9%. Then a long entered on 23 Sep at 0.004164 hit its stop for -6.12%. Two shorts hit their targets, and a short opened on 24 Sep closed at its stop for -6.14%.
What does a stop that misses look like?
On 22 Aug 2026 a long was stopped out on the very next 15m bar at -10.99% (-9,005.45 USDT), almost double the planned 6%. Price gapped through the stop level. On perpetuals this can happen, and backtest fills show it.
Where is price now?
At capture (28 Sep) price was near 0.0035, moving sideways after the spike to about 0.004 and the drop back. The notes say this strategy struggles when price chops and snaps back. A long from 24 Sep is still open.
Bias: Neutral. The strategy simply waits for its next signal. Frequent stop-outs in a sideways band would be the warning sign, since a 55.31% win rate with a 0.944 payoff ratio leaves little room.
Risk: max drawdown was 35.24% (47,482 USDT) in the report, profit factor is 1.169, and the worst closed-trade month, Dec 2025, lost 29,451 USDT. One year and 226 closed trades is a small sample.
Backtest results don't guarantee future performance. Not financial advice.