


📊 Market Structure
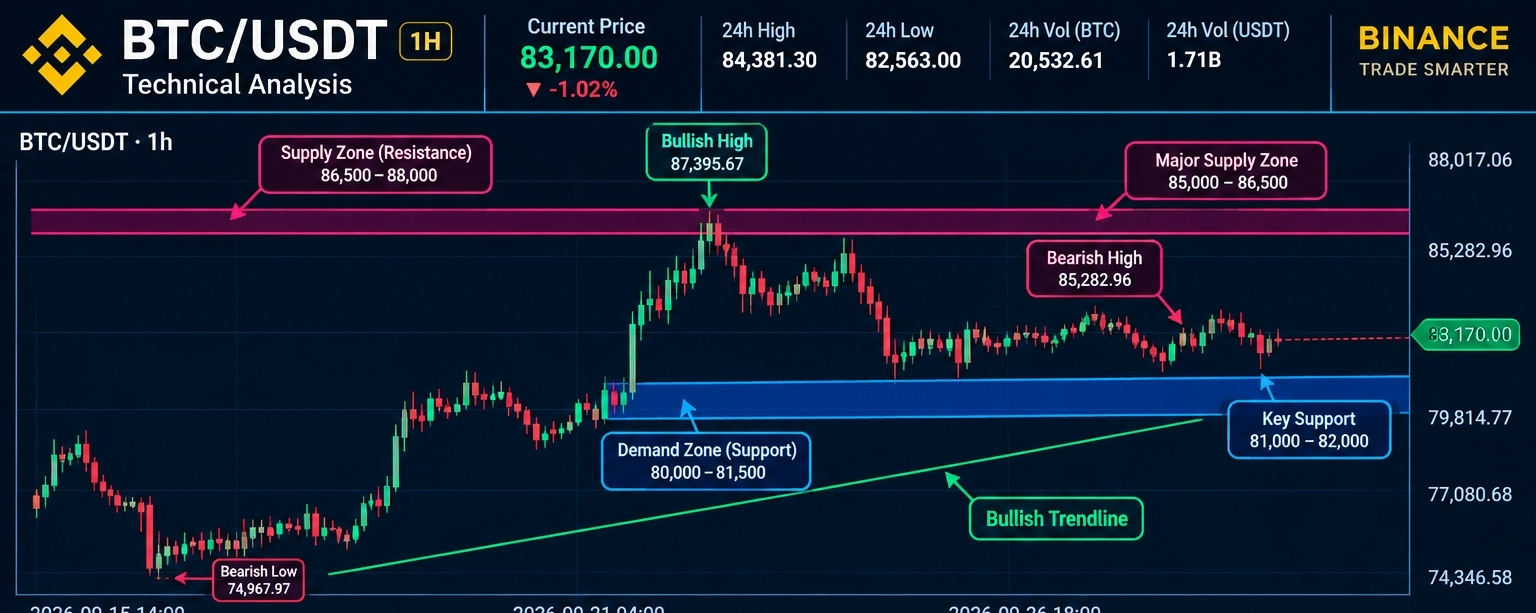
BTC remains above the major support area but is currently in a pullback/consolidation phase after the move toward $87K. Recent market data also shows BTC trading around the low-$83K area.
Current Price: ~$83,170
24H High: $84,381.30
24H Low: $82,563.00
📈 Bullish Scenario
A strong 1H close above $85,000–$86,500, followed by a successful retest, could bring the $87,000–$88,000 area into focus.
📉 Bearish Scenario
A rejection around $85,000–$86,500 followed by a break below $81,000 could bring attention toward the $80,000–$81,500 demand zone.
🔑 Key Levels
Supply Zone: $86,500–$88,000
Major Resistance: $85,000–$86,500
Demand Zone: $80,000–$81,500
Key Support: $81,000–$82,000
Bullish High: $87,395.67
Bearish Low: $74,967.97
🕯️ Candle Guide
🟢 Green candle = Bullish pressure
🔴 Red candle = Bearish pressure
↕️ Long wick = Rejection/uncertainty
💥 Strong breakout candle = Strong momentum
BUY or SELL?
I can’t tell you personally to BUY or SELL. For learning from this chart, the direction is not confirmed at ~$83,170: watch for a confirmed breakout above resistance or a confirmed breakdown below support.