



SHIB remains near its lower range, while mixed exchange flows show buyers and sellers remain active across the market.
Historical price action shows sharp rallies followed extended weakness, but past performance does not guarantee another explosive move.
Exchange flows remain uneven, leaving sustained buying pressure as an important factor for any broader recovery.
SHIB price remains near the lower end of its long decline, while mixed exchange flows and historical patterns keep accumulation in focus.
Long Decline Keeps Accumulation Debate Alive
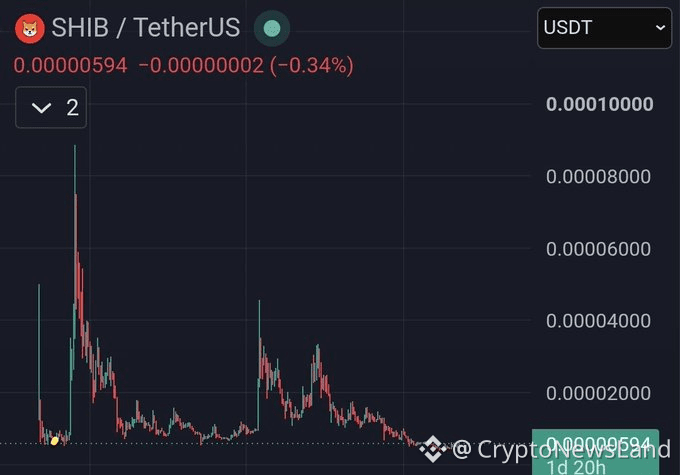
The latest chart places SHIB near the bottom of its broader decline. The token has spent an extended period trading below earlier cycle highs. This structure forms the basis for the accumulation argument presented by SHIB KNIGHT.
 Source: X
The commentary points toward similar trading conditions during 2023. SHIB later experienced a sharp advance during early 2024. That move demonstrated how quickly the token could reprice after prolonged weakness.
The current chart does not show a confirmed breakout from this extended structure. Instead, price remains compressed near historically lower trading levels. Recent movements have also shown relatively limited volatility around the current range.
As of writing the market data shows a price near $0.055873. Reported 24-hour volume stands at $112.84 million. The token has also recorded a 9.60% gain across the past seven days.
Historical Targets Frame the Potential Upside
SHIB KNIGHT identifies several potential reference levels from the current area. A move toward $0.00002 would represent roughly 3.4 times the present level. Reaching $0.00003 would represent approximately five times the current price.
The previous all-time high represents a considerably larger distance from current levels. The post estimates that move at roughly 14 times from $0.0000059. These figures describe possible price multiples rather than confirmed market targets.
The historical chart shows why such calculations attract attention around prolonged consolidation. Earlier explosive advances followed periods of subdued trading and limited enthusiasm. However, previous rallies cannot establish that the same sequence will repeat.
The provided price data indicates that the current price is approximately $0.055873. The 24-hour volume is reported at $112.84 million. The token has also recorded a 9.60% gain across the past seven days.
Exchange Flows Remain Mixed Across SHIB
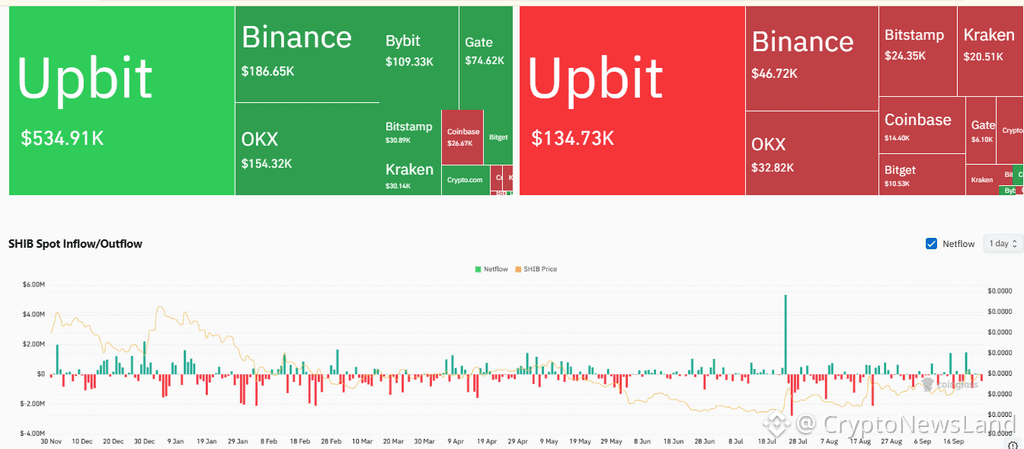
The spot-flow data shows alternating buying and selling activity across exchanges. Upbit records approximately $534.91K in positive flow on the displayed heatmap. Binance, OKX, Bybit, and Gate also show notable positive figures.
 Source: Coinglass
The opposing section records negative flows across several major platforms. Binance records approximately $46.72K, whereas OKX records approximately $32.82K. Bitstamp and Kraken are around $24.35K and $20.51K respectively.
The longer chart reinforces this uneven flow structure. Green and red bars repeatedly alternate around the zero line. Several larger spikes appeared during periods when the token experienced sharper price movements.
A notable positive spike exceeded $5 million around late July. Later readings continued alternating through August and September. The data therefore shows active exchange movement without establishing sustained one-directional pressure.
The structure as of writing, leaves accumulation as a developing possibility rather than an established trend. Continued price stability would provide further context for interpreting these flows. For now, the market remains defined by compressed pricing and uneven exchange activity.