📈 SEI/USDT Technical Analysis
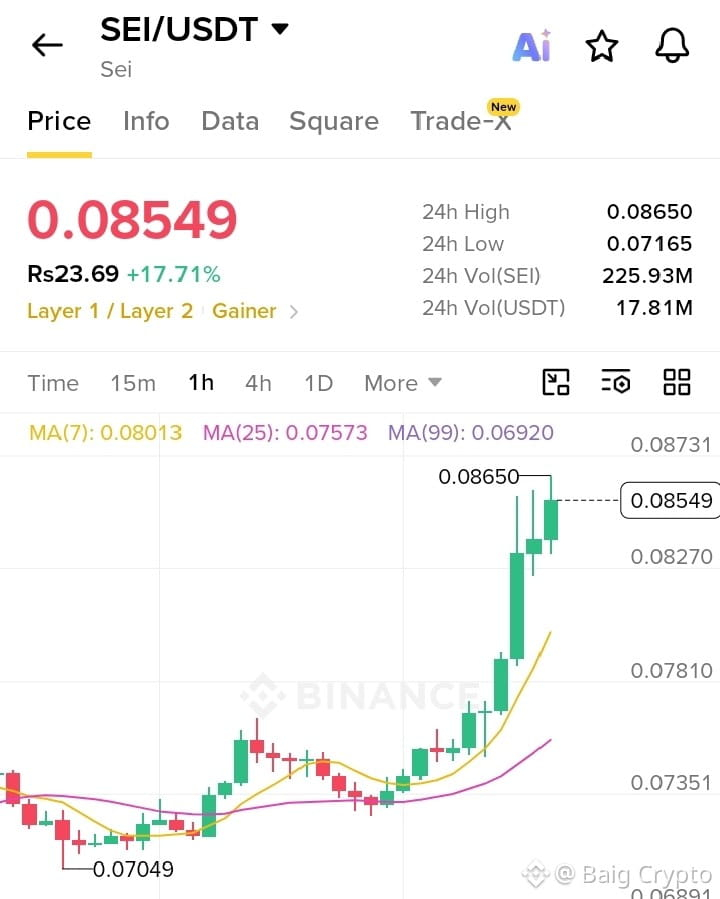
$SEI is showing strong bullish momentum on the 1H chart, with price around $0.08549 and a recent high of $0.08650. Trading volume has also increased significantly.
If $SEI breaks and holds above $0.08650, the next levels to watch are:
🎯 $0.09000
🎯 $0.09500
🎯 $0.10000
Key support: $0.08200–$0.08000
A pullback in $SEI is also possible after this sharp move. Watch the 1H candle close and volume for confirmation.
The next major move could depend on whether SEI can turn $0.08650 into support.
#SEİ
$SEI is showing strong bullish momentum on the 1H chart, with price around $0.08549 and a recent high of $0.08650. Trading volume has also increased significantly.
If $SEI breaks and holds above $0.08650, the next levels to watch are:
🎯 $0.09000
🎯 $0.09500
🎯 $0.10000
Key support: $0.08200–$0.08000
A pullback in $SEI is also possible after this sharp move. Watch the 1H candle close and volume for confirmation.
The next major move could depend on whether SEI can turn $0.08650 into support.
#SEİ