📊 #ZECUSDT — 1 DAY TECHNICAL ANALYSIS
🚀 VJ ANALYSIS | TRADE • ANALYZE • GROW
━━━━━━━━━━
🔥 MARKET STRUCTURE#zec
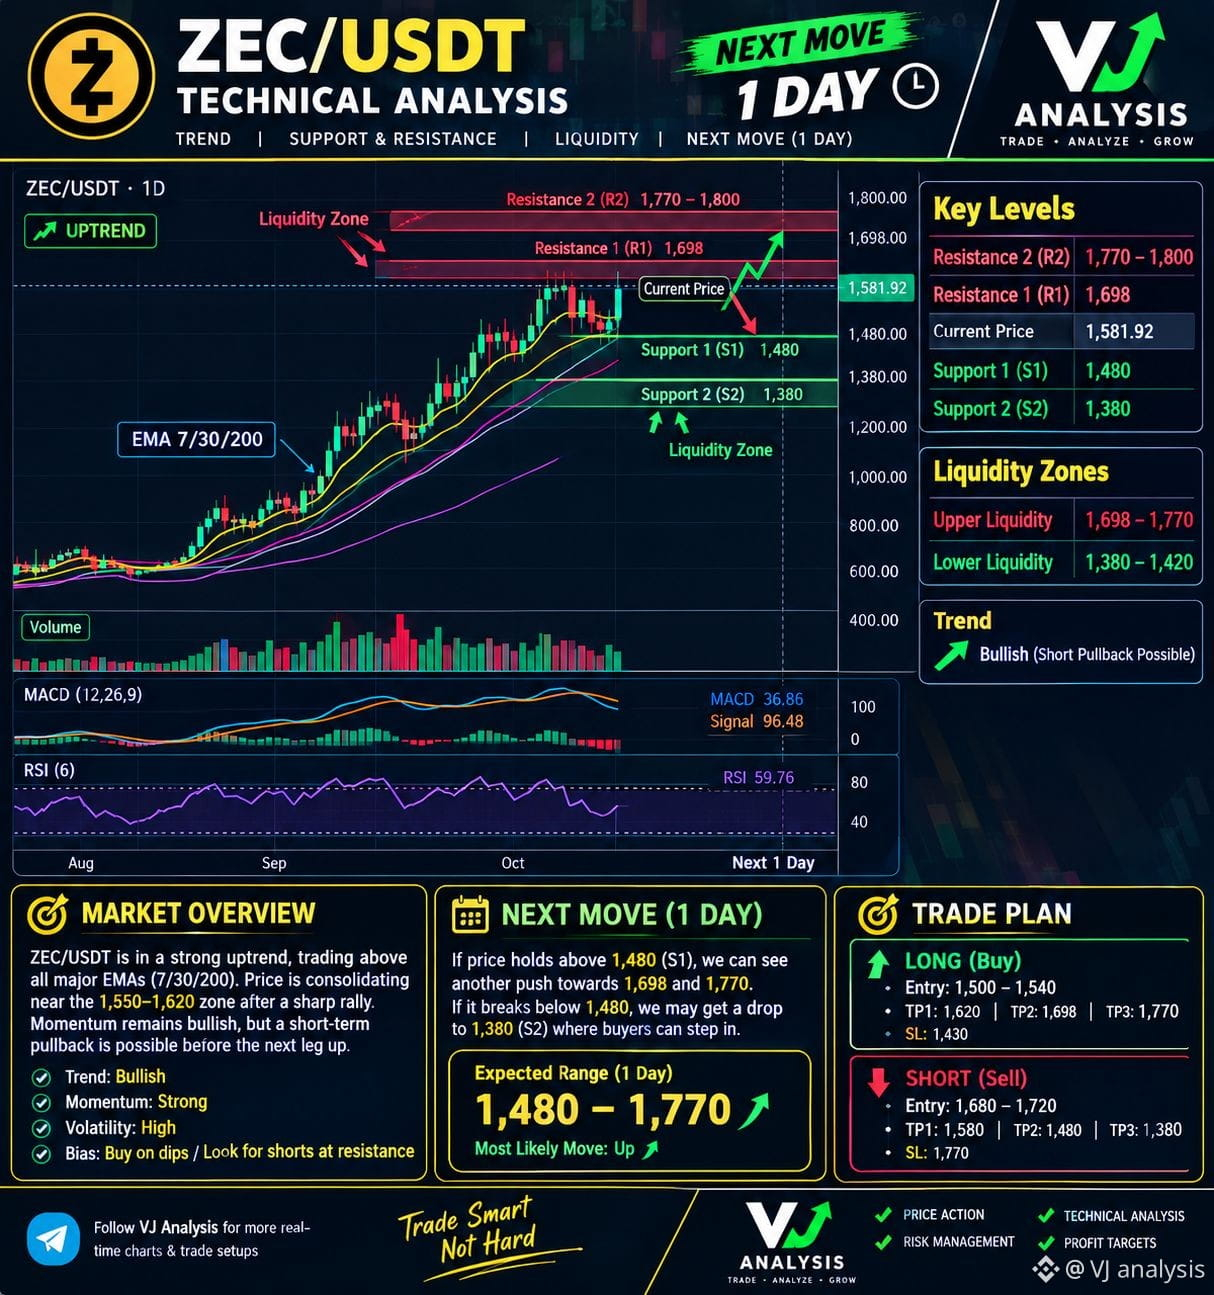
ZEC/USDT remains in a strong bullish structure on the 1D chart. Price is currently around 1,581.92, holding above the major moving averages and consolidating after a sharp upside move.
Momentum is still positive, although a short-term pullback or sideways consolidation can occur before the next expansion.
📈 Trend: Bullish
⚡ Momentum: Positive
🌊 Volatility: High
🎯 Key Zone: 1,550–1,620
━━━━━━━━━━
🟢 SUPPORT LEVELS
S1: 1,480
S2: 1,380
The 1,480 area is the key daily support. Holding above this zone keeps the current bullish structure intact.
If price sweeps lower liquidity around 1,380–1,420 and quickly reclaims the zone, it could become an important reaction area.
━━━━━━━━━
🔴 RESISTANCE LEVELS
R1: 1,698
R2: 1,770–1,800
The 1,698–1,770 region represents major upper liquidity. A clean breakout and daily acceptance above 1,698 could expose the 1,770–1,800 resistance zone.
⚠️ Rejection around resistance may trigger a temporary pullback toward support.
━━━━━━━━━
💧 LIQUIDITY MAP
🔴 Upper liquidity: 1,698–1,770
🟢 Lower liquidity: 1,380–1,420
Watch for liquidity sweeps before entering. Avoid chasing large candles directly into resistance.
━━━━━━━━━
🚀 NEXT 1-DAY SCENARIO
If ZEC holds above 1,480, the chart structure remains constructive, with potential tests of:
🎯 1,620 → 1,698 → 1,770
If 1,480 breaks decisively, downside attention shifts toward 1,420–1,380.
📌 Expected 1D range: 1,480–1,770
━━━━━━━
🟢 LONG SETUP#ZECUSDT
Entry zone: 1,500–1,540
TP1: 1,620
TP2: 1,698
TP3: 1,770
SL: 1,430
🔴 SHORT SETUP
Entry zone: 1,680–1,720
TP1: 1,580
TP2: 1,480
TP3: 1,380
SL: 1,770
⚠️ These are technical scenarios, not guarantees. Manage risk and wait for confirmation.
📲 VJ ANALYSIS
Trade Smart • Not Hard
🚀 VJ ANALYSIS | TRADE • ANALYZE • GROW
━━━━━━━━━━
🔥 MARKET STRUCTURE#zec
ZEC/USDT remains in a strong bullish structure on the 1D chart. Price is currently around 1,581.92, holding above the major moving averages and consolidating after a sharp upside move.
Momentum is still positive, although a short-term pullback or sideways consolidation can occur before the next expansion.
📈 Trend: Bullish
⚡ Momentum: Positive
🌊 Volatility: High
🎯 Key Zone: 1,550–1,620
━━━━━━━━━━
🟢 SUPPORT LEVELS
S1: 1,480
S2: 1,380
The 1,480 area is the key daily support. Holding above this zone keeps the current bullish structure intact.
If price sweeps lower liquidity around 1,380–1,420 and quickly reclaims the zone, it could become an important reaction area.
━━━━━━━━━
🔴 RESISTANCE LEVELS
R1: 1,698
R2: 1,770–1,800
The 1,698–1,770 region represents major upper liquidity. A clean breakout and daily acceptance above 1,698 could expose the 1,770–1,800 resistance zone.
⚠️ Rejection around resistance may trigger a temporary pullback toward support.
━━━━━━━━━
💧 LIQUIDITY MAP
🔴 Upper liquidity: 1,698–1,770
🟢 Lower liquidity: 1,380–1,420
Watch for liquidity sweeps before entering. Avoid chasing large candles directly into resistance.
━━━━━━━━━
🚀 NEXT 1-DAY SCENARIO
If ZEC holds above 1,480, the chart structure remains constructive, with potential tests of:
🎯 1,620 → 1,698 → 1,770
If 1,480 breaks decisively, downside attention shifts toward 1,420–1,380.
📌 Expected 1D range: 1,480–1,770
━━━━━━━
🟢 LONG SETUP#ZECUSDT
Entry zone: 1,500–1,540
TP1: 1,620
TP2: 1,698
TP3: 1,770
SL: 1,430
🔴 SHORT SETUP
Entry zone: 1,680–1,720
TP1: 1,580
TP2: 1,480
TP3: 1,380
SL: 1,770
⚠️ These are technical scenarios, not guarantees. Manage risk and wait for confirmation.
📲 VJ ANALYSIS
Trade Smart • Not Hard