$ARX
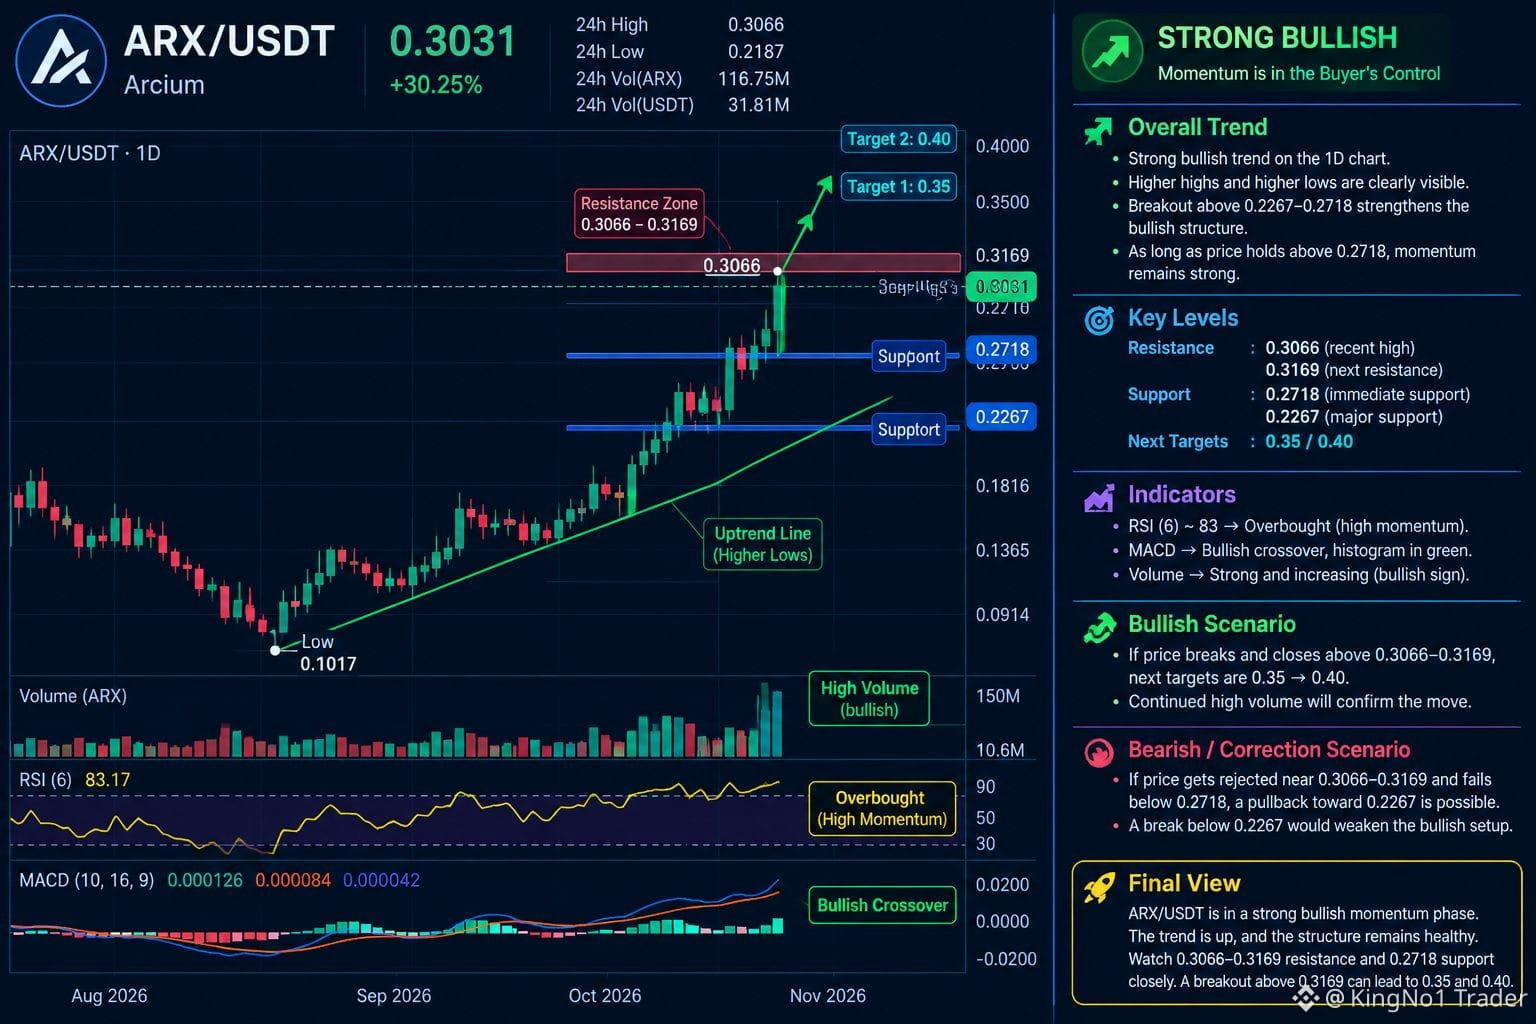
ARX is showing a very strong bullish structure on the 1D chart, with a clear sequence of higher highs and higher lows after forming a major low around 0.1017. Price has now surged to 0.3031, with the recent high at 0.3066, while volume has expanded significantly—confirming strong participation behind the upward move. The breakout above the previous 0.2267–0.2718 area further strengthens the bullish structure. As long as price holds above 0.2718, the current momentum remains technically strong.
Key levels: The immediate resistance is 0.3066, followed by the 0.3169 area. A decisive daily close above 0.3066–0.3169 could expose the next psychological zones around 0.35 and 0.40. RSI is around 83, indicating extremely strong momentum but also an overbought condition, so a short consolidation or pullback can occur without necessarily breaking the bullish structure. The main levels to monitor on any pullback are 0.2718, then 0.2267; holding these areas would keep the broader bullish setup intact.
ARX is showing a very strong bullish structure on the 1D chart, with a clear sequence of higher highs and higher lows after forming a major low around 0.1017. Price has now surged to 0.3031, with the recent high at 0.3066, while volume has expanded significantly—confirming strong participation behind the upward move. The breakout above the previous 0.2267–0.2718 area further strengthens the bullish structure. As long as price holds above 0.2718, the current momentum remains technically strong.
Key levels: The immediate resistance is 0.3066, followed by the 0.3169 area. A decisive daily close above 0.3066–0.3169 could expose the next psychological zones around 0.35 and 0.40. RSI is around 83, indicating extremely strong momentum but also an overbought condition, so a short consolidation or pullback can occur without necessarily breaking the bullish structure. The main levels to monitor on any pullback are 0.2718, then 0.2267; holding these areas would keep the broader bullish setup intact.