1000XEC/USDT 15m Chart Analysis: Support Test and Potential Path Setup 🚀
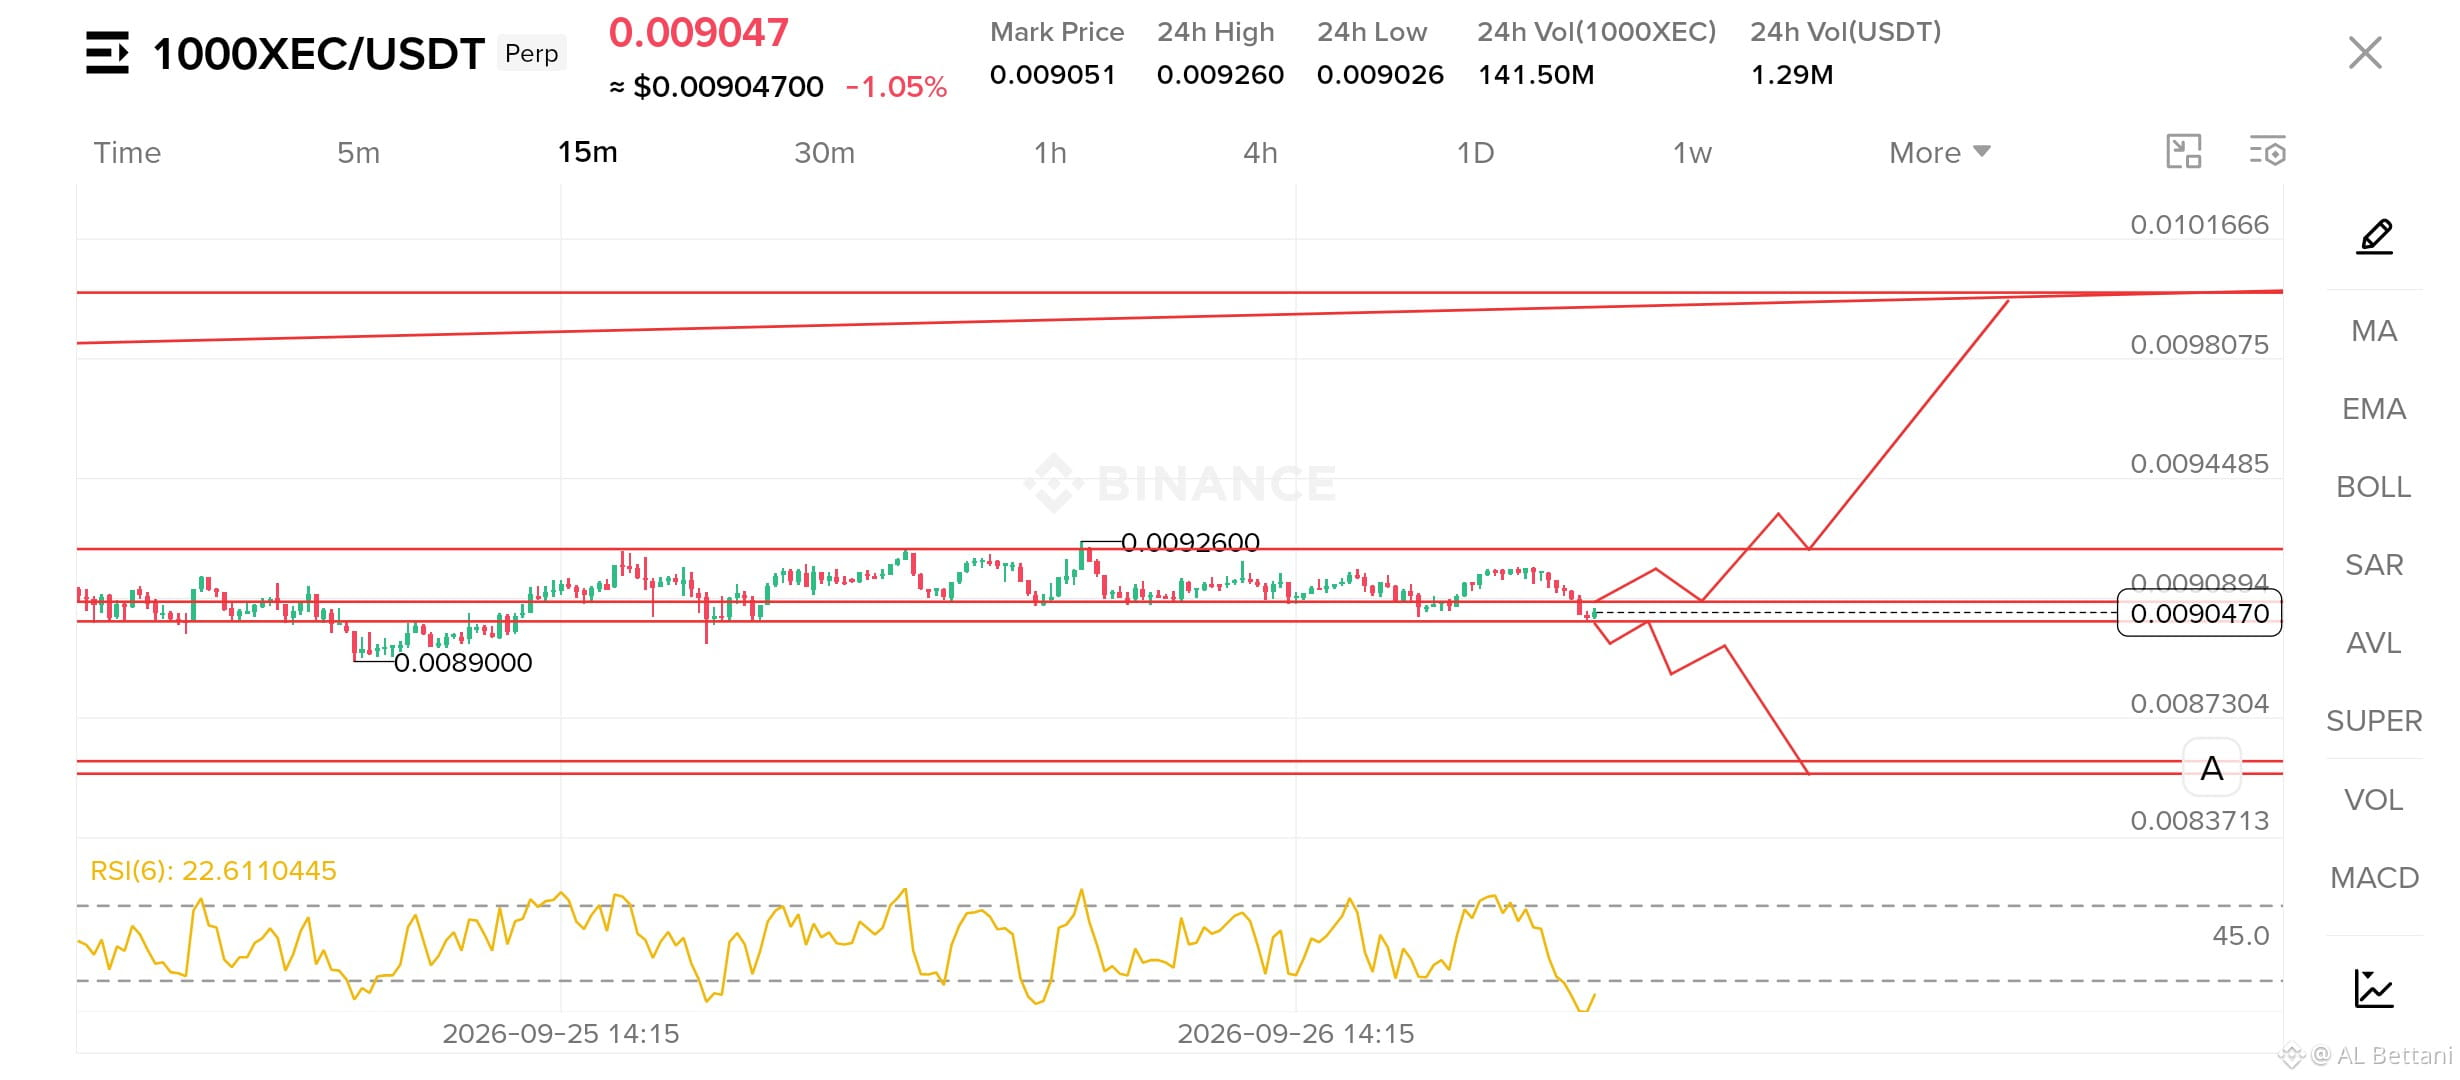
Taking a look at the $1000XEC 15-minute timeframe, the price is currently trading at $0.009047 with a -1.05% change over the last 24 hours. The chart highlights a key support level near $0.008900 and a 24h high of $0.009260, with potential breakout and correction paths mapped out above.
Current Price: $0.009047
24h High / Low: $0.009260 / $0.009026
Key Support Zone: Around $0.008900
Immediate Resistance: Near $0.009260
RSI(6) is currently sitting at 22.61, indicating oversold short-term momentum which could lead to a potential bounce. Keep these critical zones on your watch list for intraday trading setups.
What is your next target for $1000XEC? Drop your analysis below! 👇
#1000XEC #cryptotrading #BinanceSquare #TechnicalAnalysis #Altcoins $1000XEC
Taking a look at the $1000XEC 15-minute timeframe, the price is currently trading at $0.009047 with a -1.05% change over the last 24 hours. The chart highlights a key support level near $0.008900 and a 24h high of $0.009260, with potential breakout and correction paths mapped out above.
Current Price: $0.009047
24h High / Low: $0.009260 / $0.009026
Key Support Zone: Around $0.008900
Immediate Resistance: Near $0.009260
RSI(6) is currently sitting at 22.61, indicating oversold short-term momentum which could lead to a potential bounce. Keep these critical zones on your watch list for intraday trading setups.
What is your next target for $1000XEC? Drop your analysis below! 👇
#1000XEC #cryptotrading #BinanceSquare #TechnicalAnalysis #Altcoins $1000XEC