

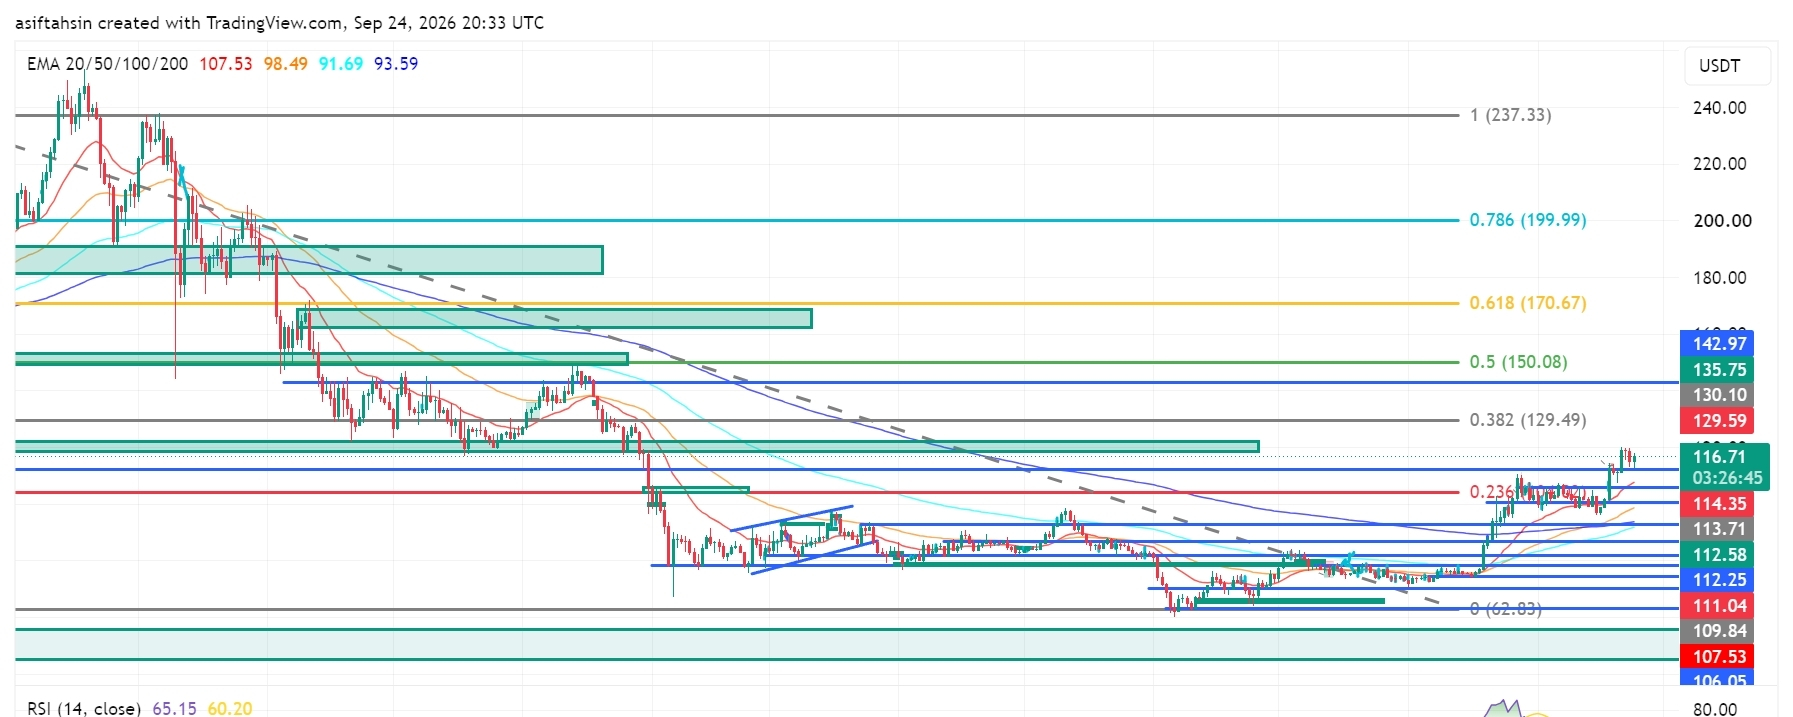

Solana is trading around $116.77, maintaining the strong recovery from the June low near $62.83. After breaking above the previous $100–$110 range, SOL is now consolidating above $114.35, with momentum still constructive. The broader structure remains improved as price holds above all major EMAs.
📈 EMA Structure
20 EMA: $107.53
50 EMA: $98.49
100 EMA: $91.69
200 EMA: $93.59
SOL remains above all four major EMAs. The 20 EMA is positioned above the 50/100/200 EMAs, showing that the recent recovery remains structurally strong.
📐 Fibonacci Levels
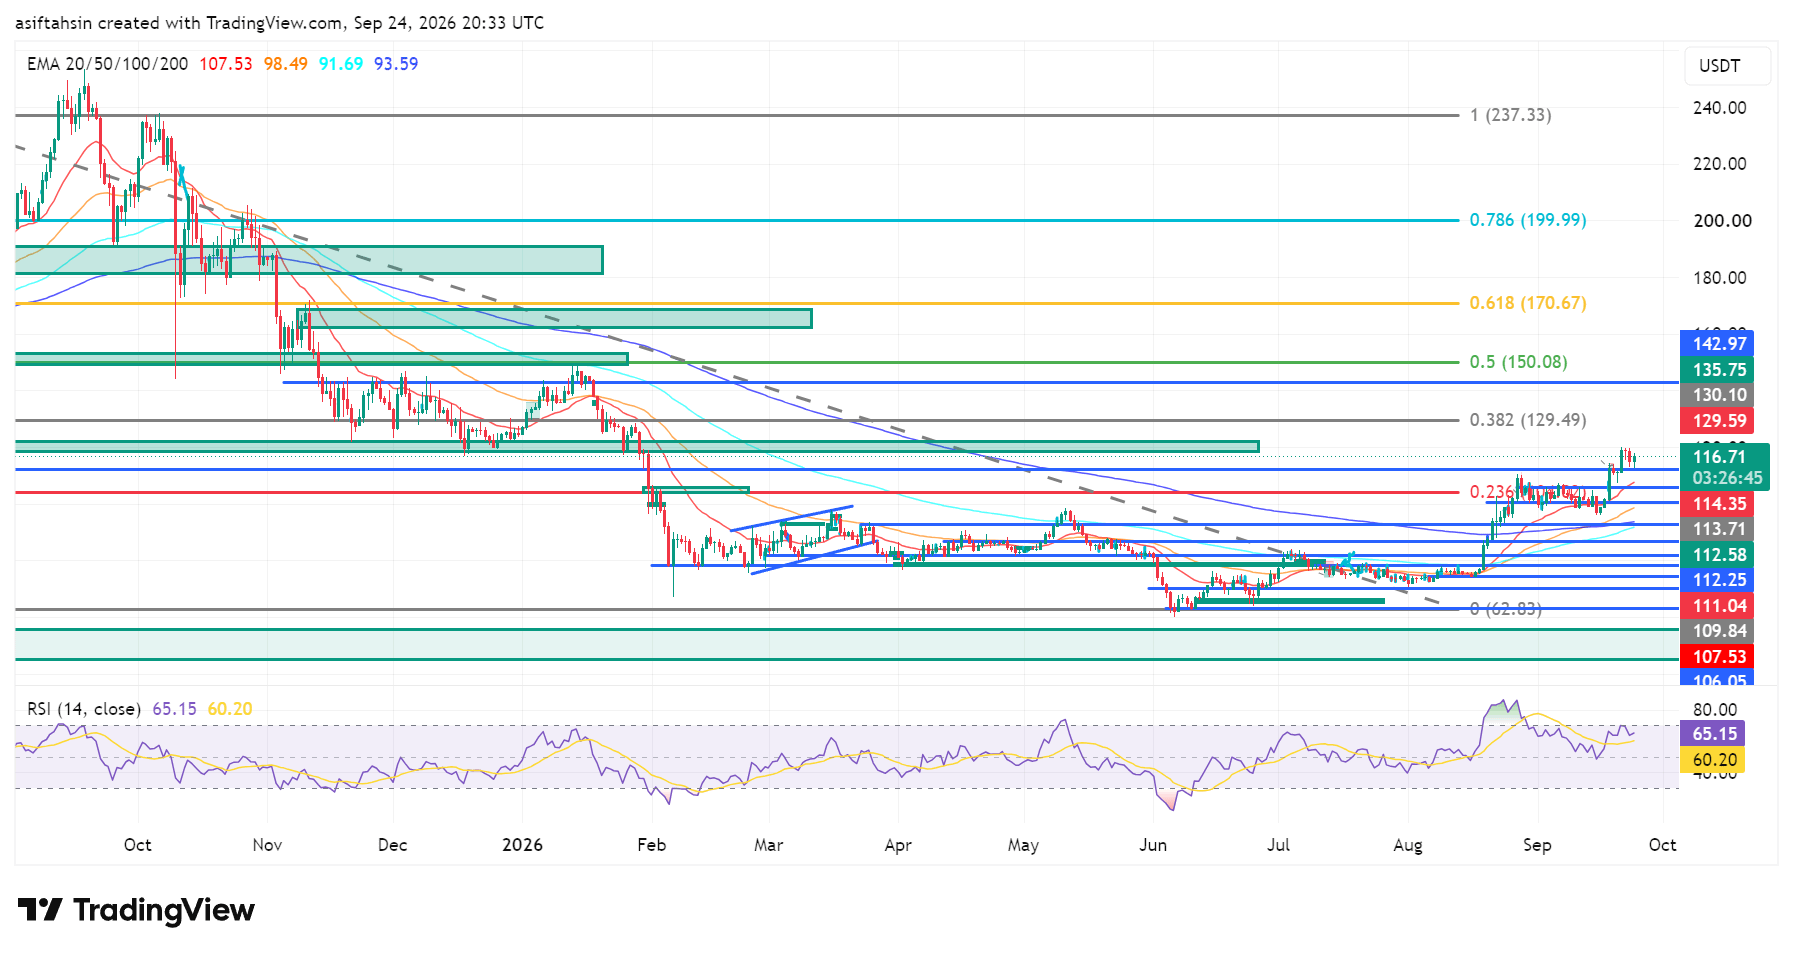
0.236: $114.35
0.382: $129.49
0.5: $150.08
0.618: $170.67
0.786: $199.99
1.0: $237.33
The immediate focus is $114.35. A sustained move above this area keeps the higher Fibonacci zones in focus, starting with $129.49, followed by $150.08.
🟢 Bullish Scenario
SOL is holding above the $114.35 zone while trading near $116.77.
A continued move higher could bring:
$129.49 — 0.382 Fib
$150.08 — 0.5 Fib
$170.67 — 0.618 Fib
$199.99 — 0.786 Fib
$237.33 — major Fib level
The $129–$130 region is the next major resistance area after the current consolidation.
🔴 Pullback Scenario
Key nearby supports are:
$113.71
$112.58
$112.25
$111.04
$109.84
$107.53 — 20 EMA
$106.05
$102.29
$98.49 — 50 EMA
The $109.84–$107.53 region is an important dynamic support area. Holding above it would keep the broader recovery structure intact.
🧠 Market Structure & Liquidity
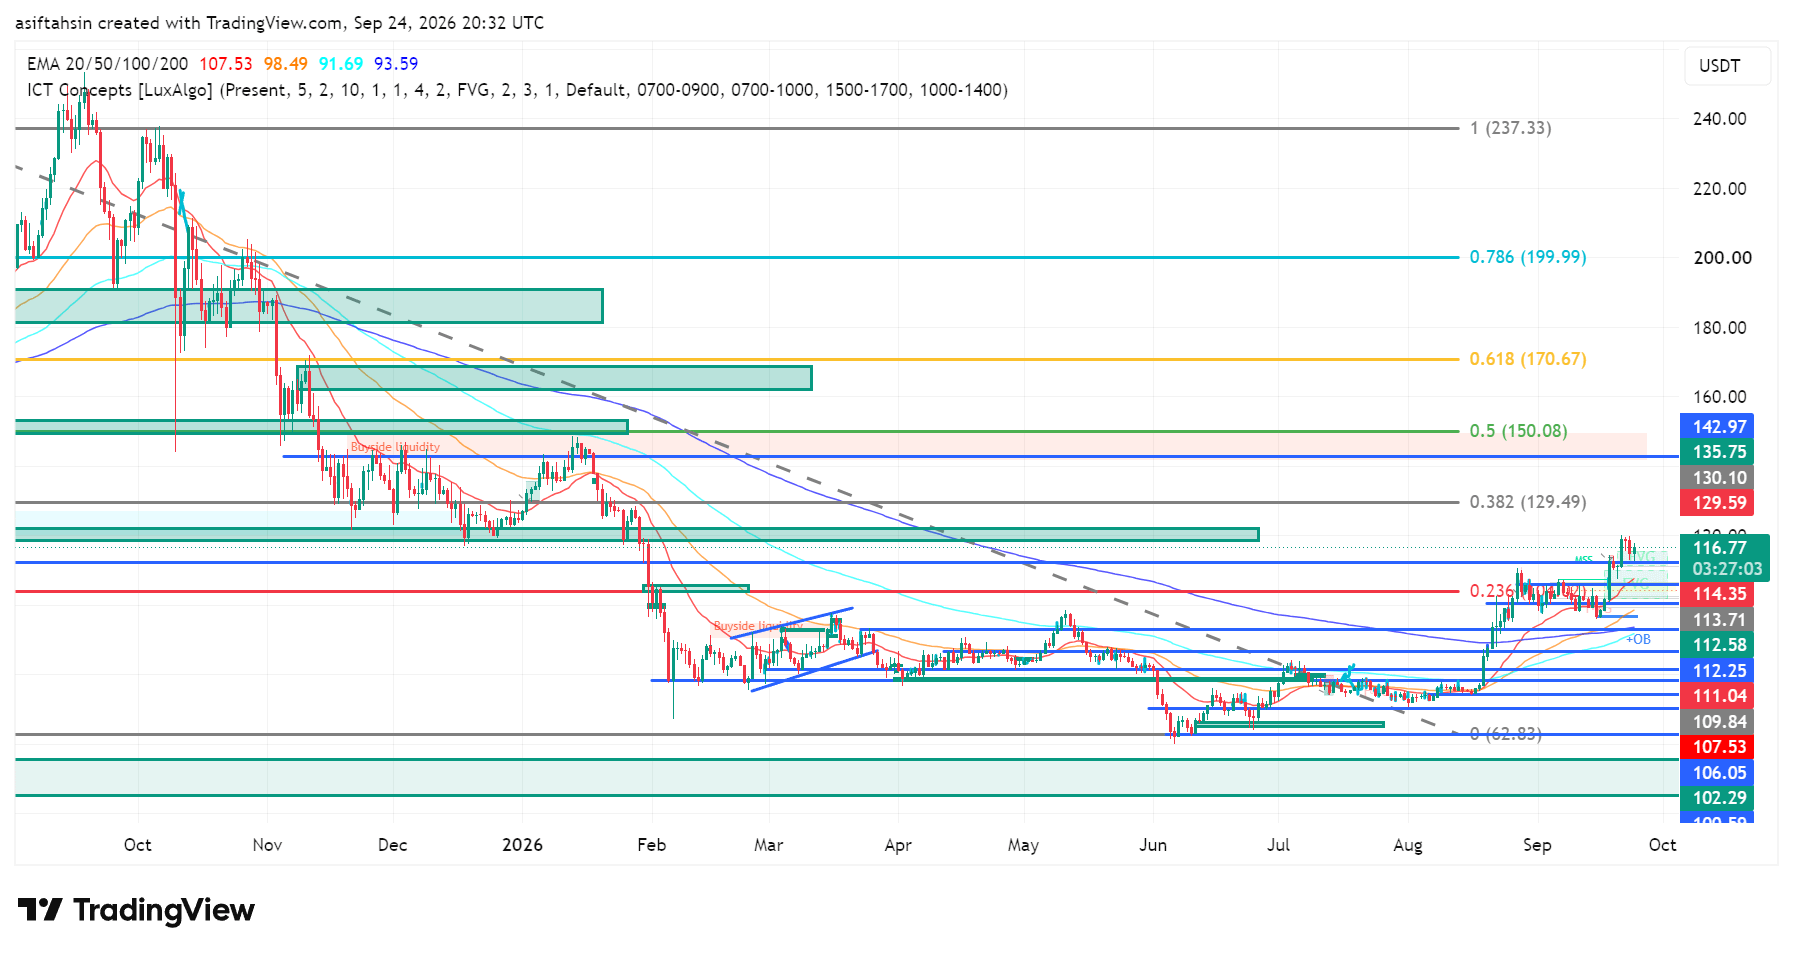
SOL has developed a clear Recovery → Breakout → Retest → Consolidation → Continuation structure.
Price moved from the $62.83 low into the $100+ region, broke higher, and is now consolidating around $114–$117. The next major upside liquidity/resistance area is around $129–$130.
📊 RSI Momentum
RSI: 65.15
Signal: 60.20
Momentum remains positive, with RSI above 60. It is approaching the 70 zone but is not yet deeply overextended.
🎯 Main Chart Levels
Resistance: $116.77 → $129.49 → $150.08 → $170.67
Support: $114.35 → $112.58 → $111.04 → $109.84 → $107.53
📌 Final Outlook
SOL's recovery structure remains constructive while price holds above the $107.53–$109.84 area. The immediate chart focus is $114.35–$116.77; a sustained move above the current range would bring $129.49 into focus, with $150.08 as the next major Fibonacci level.
Current market data also places SOL around the mid-$110s, broadly consistent with the chart structure shown.
