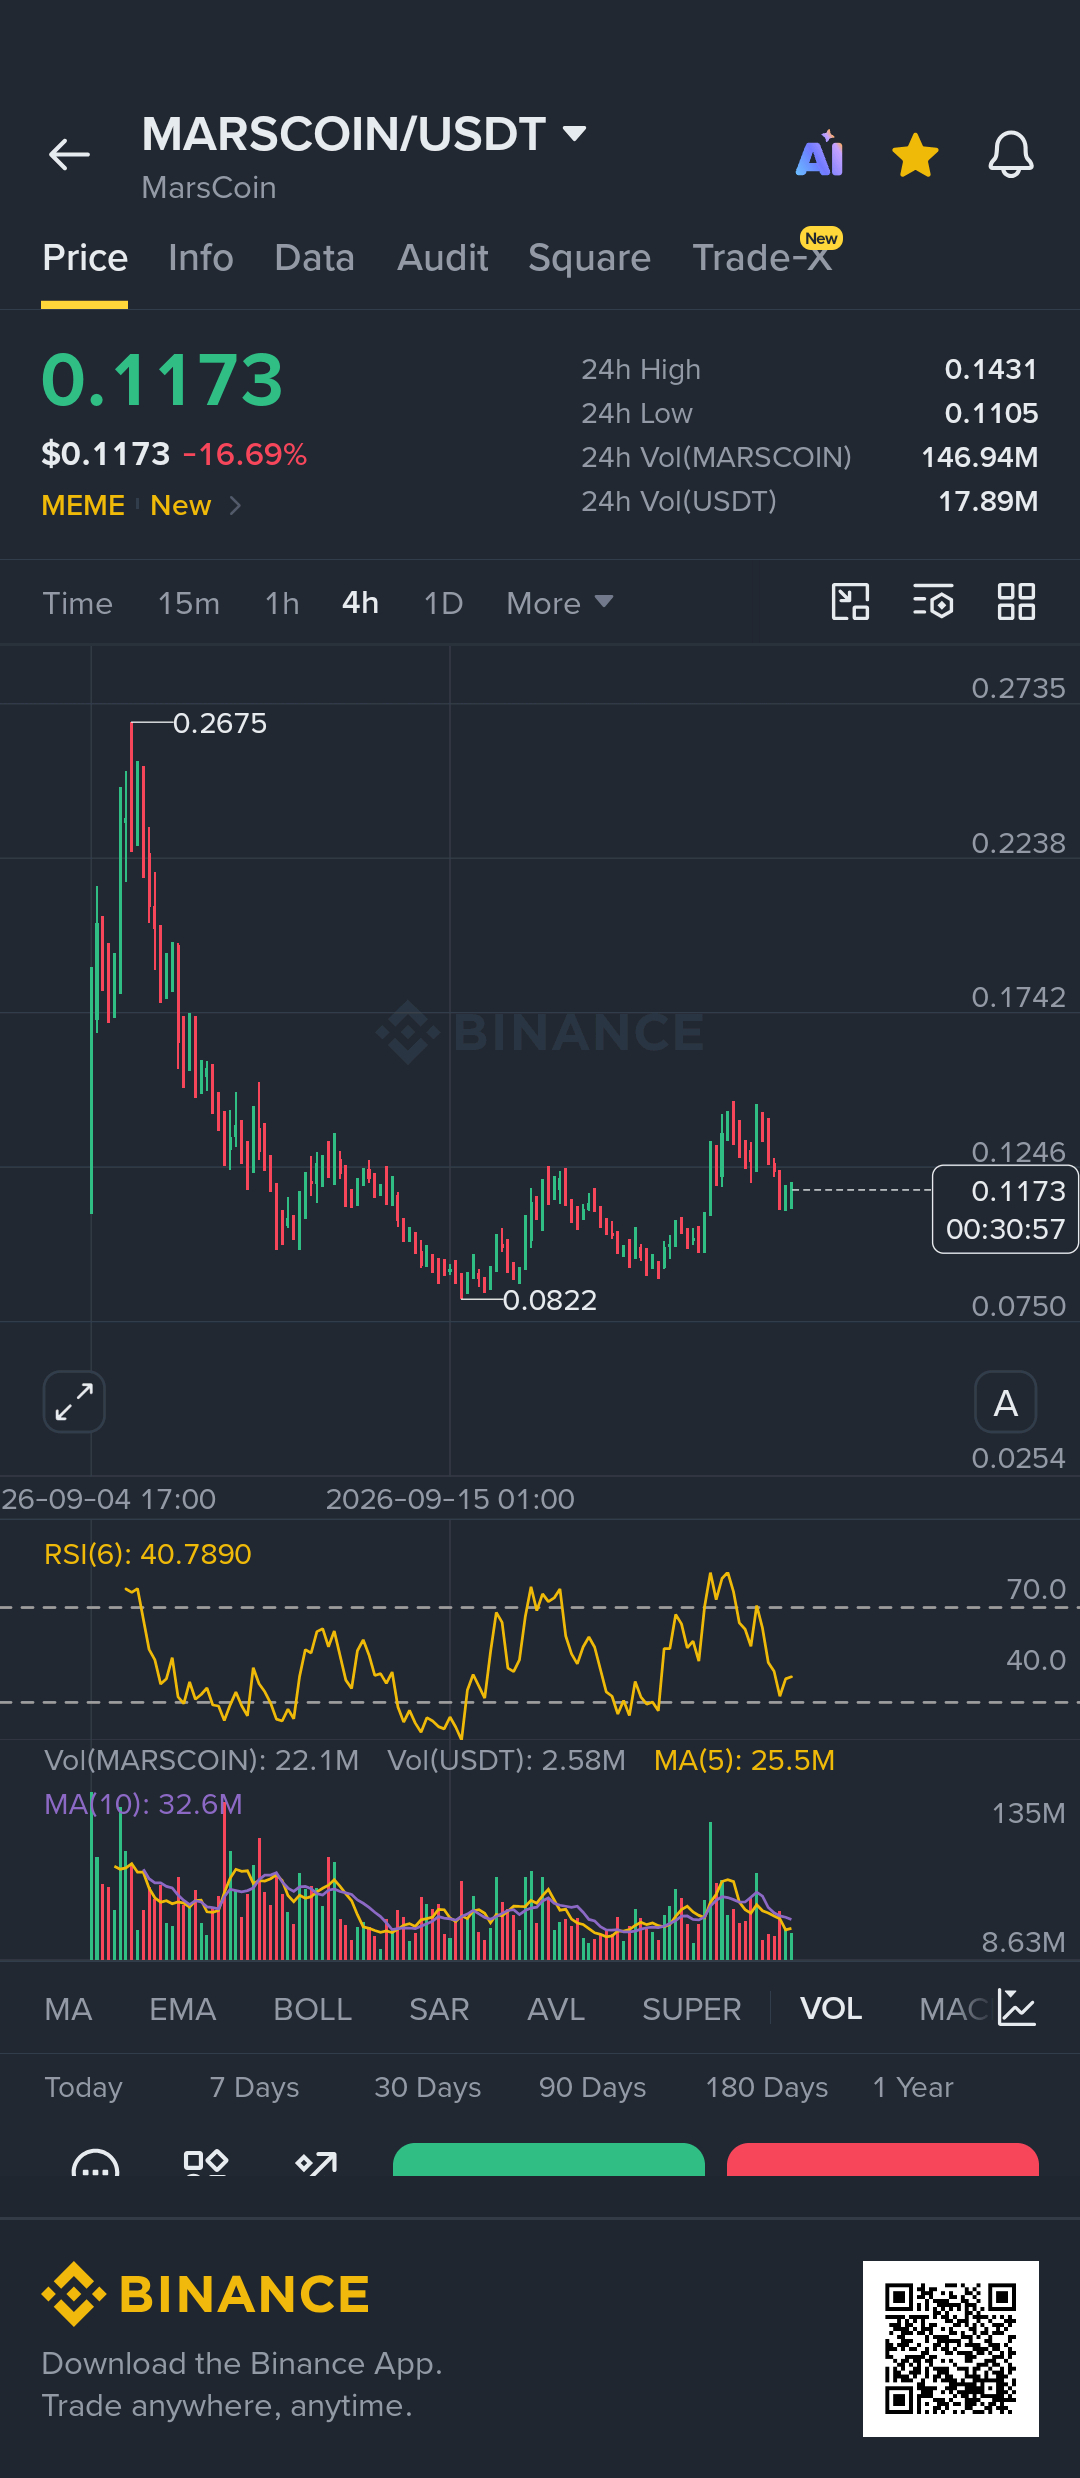

📊 Current structure
Price: ~$0.1173
24H high: $0.1431
24H low: $0.1105
RSI(6): ~40.8
The big picture is:
$0.2675 → sharp selloff → $0.0822 → recovery/range → recent spike → pullback
So the coin is currently trying to establish whether the area around $0.11–$0.125 can become a new trading range.
Key levels
Level
Importance
$0.143–0.145
Major near-term resistance
$0.124–0.126
First important resistance
$0.117
Current price
$0.110–0.112
Immediate support
$0.095–0.100
Deeper support
$0.0822
Major swing low
🟢 Bullish scenario
If buyers defend $0.110–0.112 and price gets back above $0.124–0.126 with strong 4H volume, that would be a meaningful improvement in structure.
The next area I'd watch would be roughly $0.140–0.145.
A clean 4H close above that area would be considerably more significant than simply wicking above it.
🔴 Bearish scenario
If $0.110 breaks decisively on a 4H closing basis, the chart becomes weaker.
Then I'd watch approximately:
$0.10 → $0.095 → $0.0822
The $0.0822 level is particularly important because that's the visible major swing low on your chart.
📉 RSI + volume
The RSI around 40.8 is interesting.
It's not oversold, but it's also below the 50 area, so momentum currently isn't particularly strong.
More importantly, the recent move upward toward ~$0.14 appears to have been followed by selling, while volume has cooled. That means I'd want to see buyers return with increasing volume before treating another push upward as a confirmed breakout.