

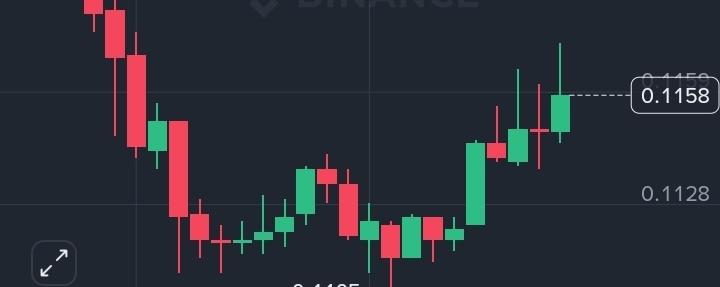

Short-term recovery / possible early uptrend on the lower timeframes, but not a clean sustained uptrend yet.
### Chart breakdown (from the screenshot)
- Sharp dump: Price fell hard from ~0.1243 down to the 0.1105 low (clear cascade of red candles).
- Bounce: After hitting 0.1105 it stabilized and printed a series of higher lows with green candles, reclaiming up to 0.1158.
- Current price is still well below the earlier high of the session and the 24h high (0.1448).
- Volume is elevated on the dump and still decent on the bounce.
- 7-day performance is strongly positive (+28.70%), while today is red (−17% / −5.78% on the pair).
This is classic relief bounce / short-term higher-low structure after a sell-off. On the 15m/1h it can look like the start of an uptrend if buyers keep defending the recent lows and push through the local highs. On higher timeframes it’s still in a broader downtrend from the September ATH around $0.26.
### Key levels to watch
- Support: 0.1105–0.1120 zone (today’s low). A clean break and hold below that would invalidate the short-term bounce.
- Resistance: 0.118–0.120 area, then the stronger zone near 0.124–0.125 (previous breakdown level). Clearing and holding above ~0.122–0.125 with volume would make a more convincing short-term uptrend.
Bottom line: The recent price action is constructive for a bounce/continuation higher in the short term (higher lows forming), which is why it can be labeled “uptrend” on the lower timeframe. It’s still early and fragile — meme coins like this can reverse quickly. Always use risk management; this is high-volatility meme territory.