WLD IS BUILDING A NEW BASE — THE WEEKLY CHART IS AT A CRITICAL STAGE
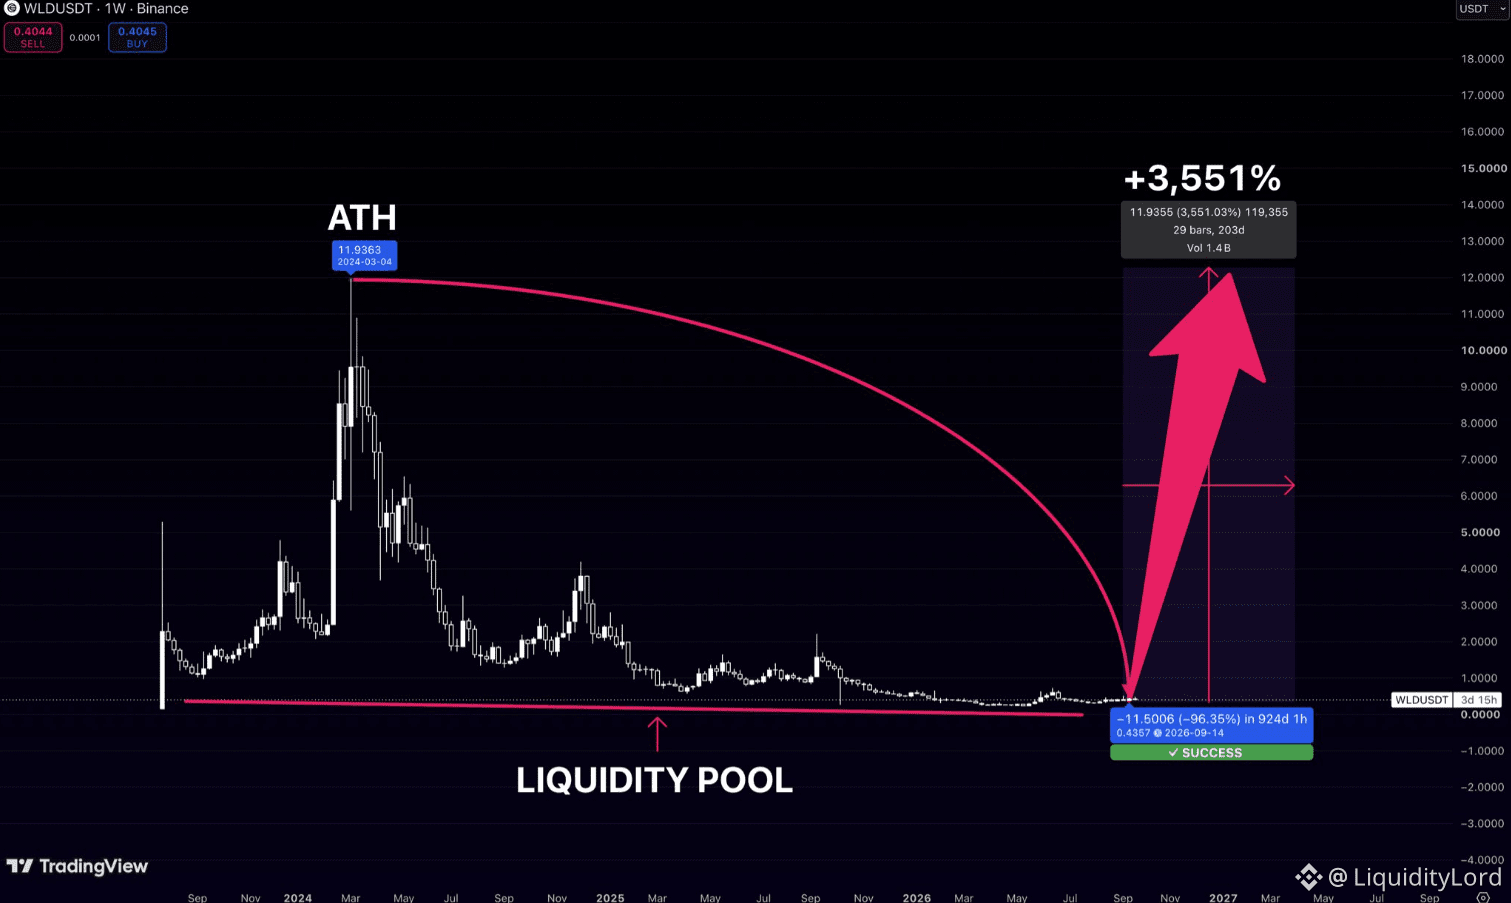
WLD/USDT on the 1W chart is trading around 0.40 after a prolonged decline from its 2024 peak. Price has spent months near the lower boundary, while the latest candles show a sharp reaction.
🧭 A LONG DECLINE MAY BE LOSING MOMENTUM
The chart shows extended compression near the lows. WLD has not confirmed a full reversal, but the latest expansion differs from the previous decline.
Price needs to establish higher weekly structure instead of returning to the lower liquidity zone. The next sustained move will help define the new range.
🎯 TRADE PARAMETERS
Entry: 0.40–0.46
Invalidation: 0.30
TP1: 0.58
TP2: 1.00
TP3: 6.20
A move through nearby resistance would indicate stronger buyer participation and give the weekly rebound more room to develop without an immediate rejection.
The larger levels shown represent a long-term scenario, not immediate objectives.
📊 FROM ATH TO LIQUIDITY
WLD previously reached 11.9363 before entering a prolonged decline. Selling eventually pushed price toward the lower part of the chart, where a broad base developed.
The reaction matters after such an extended period of weakness. Recovery would need to prove itself through structure rather than one impulsive move.
⚙ THE ST0Nfi CONNECTION
ST0Nfi brings another DeFi perspective through its liquidity infrastructure, where swap activity can interact with different sources of available liquidity. This makes the way liquidity is accessed an important part of the broader on-chain trading experience.
That is separate from WLD's technical setup. It does not confirm market direction; it simply provides a different lens for understanding decentralized swap activity.
For WLD, the weekly base remains the main area to watch. Holding the floor and developing stronger structure would change the character of the chart.
NFA - DYOR!
$WLD
WLD/USDT on the 1W chart is trading around 0.40 after a prolonged decline from its 2024 peak. Price has spent months near the lower boundary, while the latest candles show a sharp reaction.
🧭 A LONG DECLINE MAY BE LOSING MOMENTUM
The chart shows extended compression near the lows. WLD has not confirmed a full reversal, but the latest expansion differs from the previous decline.
Price needs to establish higher weekly structure instead of returning to the lower liquidity zone. The next sustained move will help define the new range.
🎯 TRADE PARAMETERS
Entry: 0.40–0.46
Invalidation: 0.30
TP1: 0.58
TP2: 1.00
TP3: 6.20
A move through nearby resistance would indicate stronger buyer participation and give the weekly rebound more room to develop without an immediate rejection.
The larger levels shown represent a long-term scenario, not immediate objectives.
📊 FROM ATH TO LIQUIDITY
WLD previously reached 11.9363 before entering a prolonged decline. Selling eventually pushed price toward the lower part of the chart, where a broad base developed.
The reaction matters after such an extended period of weakness. Recovery would need to prove itself through structure rather than one impulsive move.
⚙ THE ST0Nfi CONNECTION
ST0Nfi brings another DeFi perspective through its liquidity infrastructure, where swap activity can interact with different sources of available liquidity. This makes the way liquidity is accessed an important part of the broader on-chain trading experience.
That is separate from WLD's technical setup. It does not confirm market direction; it simply provides a different lens for understanding decentralized swap activity.
For WLD, the weekly base remains the main area to watch. Holding the floor and developing stronger structure would change the character of the chart.
NFA - DYOR!
$WLD