
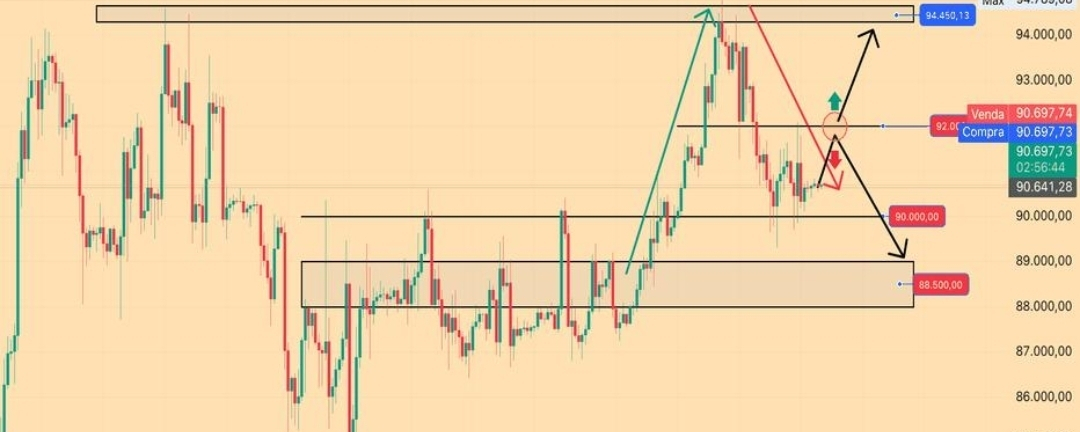

📊 Bitcoin (BTC) Latest Analysis — 21 September 2026
Bitcoin is trading around $81,200–$81,600 as of September 21, 2026. The market is currently testing an important resistance zone around $82,000–$82,500 after recovering from the recent pullback. �
Coinalyze +1
🔥 Current BTC Market Structure
The daily structure remains constructive: BTC previously broke above the $67,000 area and rallied toward $82,000–$83,000. It then consolidated roughly between $76,000 and $82,000, with the current price back near the upper end of that range. �
ZebPay
Current technical readings show BTC around $81.2K, with the 1-day moving averages still pointing upward. �
Coinalyze
🔴 Major Resistance
$82,000–$82,500 is the key zone to watch. A clean breakout and sustained trading above this area would be important technical confirmation of further upside momentum. �
ZebPay +1
🟢 Important Supports
$80,000–$80,900 — immediate support area
$79,000–$79,100 — important EMA/support zone
$76,000–$76,500 — deeper range support
$73,000–$74,000 — major longer-term support area �
ZebPay +1
📈 Bullish Scenario
If BTC breaks above $82,000–$82,500 and holds the breakout, traders may watch the next psychological levels above the current range.
The important point is confirmation, rather than assuming that simply touching $82K means a breakout. One current analysis identifies approximately $82,179 as a key resistance/double-top area. �
Investing.com
📉 Pullback Scenario
If BTC repeatedly fails around $82K and loses the nearby $80K area, the market could return toward lower support levels. One September 21 analysis specifically describes the current recovery as a repaired pullback rather than a confirmed new breakout, with the previous closing high around $81,637 acting as a confirmation boundary. �
Structure Lens
So the key levels are:
$82.5K → breakout confirmation zone
$81.2K → current area
$80K → immediate support
$79K → important technical support
$76K → deeper support
📊 Momentum & Risk
There is a mixed short-term picture. Some technical indicators show strong upward structure, while other analyses flag overbought conditions near the $82K resistance. For example, one September 21 analysis reported an extremely high 5-hour Money Flow Index while BTC was testing $82,179. �
Investing.com
That means traders should watch price confirmation, volume and candle closes rather than relying on one indicator.
Recent institutional demand is also relevant: U.S. spot Bitcoin ETFs recorded about $433 million of net inflows on September 18, according to Investing.com, although broader macro factors such as rates, inflation concerns and bond yields remain potential sources of volatility. �
Investing.com
🎥 BTC Analysis Video
Bitcoin market analysis — September 21, 2026�
The video uses multiple timeframes, including weekly, daily, 4H, 1H and 15m charts, and discusses Fibonacci, EMA/VWAP and support/resistance zones. �
KDJ Kdj.com
🧾 Quick Trading Map
Level
What to watch
$82.5K+
Breakout/confirmation area
$82K
Major resistance
$81.2K
Current price area
$80K
Immediate support
$79K
Important support/EMA
$76K
Deeper range support
$73–74K
Major structural support
Bottom line: BTC is currently sitting between strong resistance near $82K–$82.5K and support around $80K–$79K. The next meaningful move will depend heavily on whether price can establish a sustained breakout above resistance or instead loses the nearby support zone. This is a market analysis, not a guarantee of future price movement. �
ZebPay +1