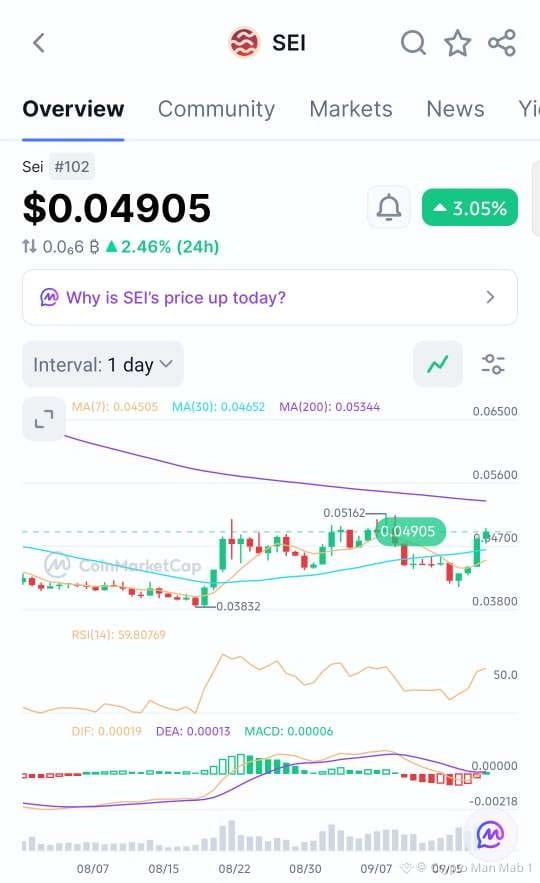
$SEI is showing signs of a recovery on the daily chart after bouncing from the $0.0383 area.
Price is now around $0.049 and has reclaimed the 30-day MA at $0.0465. The 7-day MA is also below price at $0.0450, which supports the short-term bullish structure.
RSI is around 60, so momentum is improving without being extremely overbought. MACD has also turned positive, with DIF above DEA, suggesting buyers are starting to regain control.
The main level I’m watching is $0.0516. If SEI breaks and holds above this resistance, the next important area is around $0.0534, which also lines up with the 200-day MA.
For a pullback, $0.0465–$0.0470 is the key zone to watch. Holding this area could keep the recovery structure intact.
Overall, SEI is showing improving momentum, but the $0.0516–$0.0534 zone is where the real breakout confirmation would come.
Price is now around $0.049 and has reclaimed the 30-day MA at $0.0465. The 7-day MA is also below price at $0.0450, which supports the short-term bullish structure.
RSI is around 60, so momentum is improving without being extremely overbought. MACD has also turned positive, with DIF above DEA, suggesting buyers are starting to regain control.
The main level I’m watching is $0.0516. If SEI breaks and holds above this resistance, the next important area is around $0.0534, which also lines up with the 200-day MA.
For a pullback, $0.0465–$0.0470 is the key zone to watch. Holding this area could keep the recovery structure intact.
Overall, SEI is showing improving momentum, but the $0.0516–$0.0534 zone is where the real breakout confirmation would come.