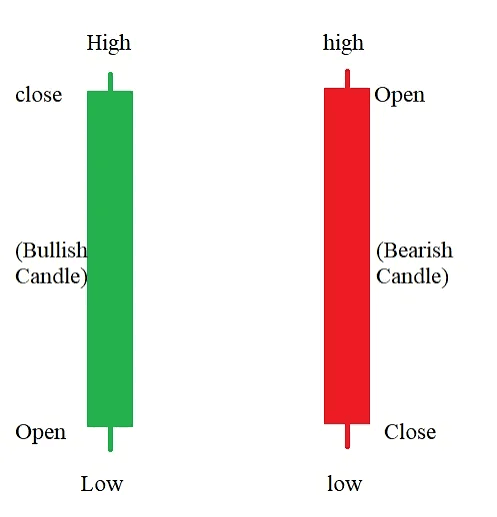
Candlestick charts show price movements over a set timeframe using a main body and wicks.
* Structure: The body shows the opening and closing prices, while the wicks (or shadows) display the highest and lowest prices.
* Colors: Green (bullish) means the price went up, while red (bearish) means the price went down.
* Analysis: The sizes
of the body and wicks help traders assess buyer and seller strength.
#technical_analysis $BTC
* Structure: The body shows the opening and closing prices, while the wicks (or shadows) display the highest and lowest prices.
* Colors: Green (bullish) means the price went up, while red (bearish) means the price went down.
* Analysis: The sizes
of the body and wicks help traders assess buyer and seller strength.
#technical_analysis $BTC