

Crypto Trading Timeframes Explained: How to Read 1M, 15M, 1H & 4H Charts
One of the biggest mistakes new crypto traders make is looking at only one timeframe.
You open a 1-minute chart and see a strong green candle. It looks bullish.
But then you switch to the 1-hour chart…
And suddenly, the bigger picture looks completely different.
So which timeframe should you trust?
The answer is: you don't necessarily have to choose just one.
Different timeframes provide different pieces of information. Learning how to combine them can help you understand market structure more clearly and avoid making decisions based only on short-term price movement.
1-Minute Chart — The Noise & The Details
The 1-minute timeframe shows extremely short-term price movement.
It can be useful for traders who are looking at very short-term setups, but it also contains a lot of market noise.
A small price movement can look like a major trend reversal on a 1-minute chart, even when the larger market structure hasn't changed.
This is why beginners can easily fall into the trap of reacting to every candle.
Key idea:
The 1M chart can show you detail, but detail doesn't always mean direction.
15-Minute Chart — Short-Term Structure
Moving to the 15-minute timeframe gives you a cleaner view of short-term market structure.
You can start identifying:
• Higher highs and higher lows
• Lower highs and lower lows
• Support and resistance areas
• Breakouts and failed breakouts
• Short-term trend changes
For many short-term traders, the 15M chart can provide more context than the 1M chart while still showing relatively recent price action.
1-Hour Chart — The Bigger Intraday Picture
The 1-hour timeframe can help you step back from the noise.
Instead of focusing on every small candle, you're looking at the broader intraday structure.
For example, the 1M chart may show several bullish candles while the 1H chart is still inside a larger downtrend.
That doesn't automatically mean the short-term move is useless.
It simply means you should understand where that move is happening within the bigger structure.
4-Hour Chart — Market Structure
The 4-hour chart gives an even broader perspective.
It can help traders identify major areas where price has previously reacted and understand whether the market is generally trending, ranging, or transitioning between conditions.
A short-term setup can look attractive on the 1M chart, but its context may become very different when viewed against the 4H structure.
This is why higher timeframes can be useful for context even when your actual trade is much shorter.
So, How Should You Combine Timeframes?
Instead of asking:
“Which timeframe is the best?”
A better question is:
“What information do I need from each timeframe?”
One simple framework is:
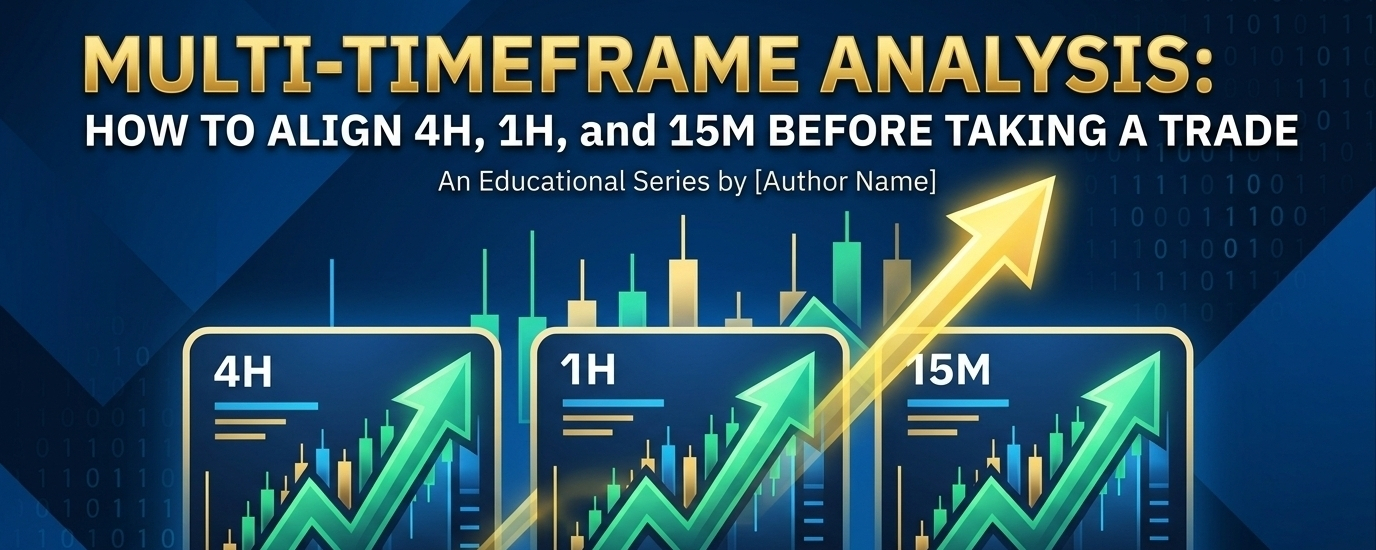
4H → Overall market structure
1H → Intraday direction/context
15M → Short-term structure
1M → Entry-level detail
This doesn't mean every trader must use these exact timeframes.
Your timeframe combination should depend on your trading style, strategy and risk tolerance.
The Biggest Mistake: Trading the Candle Instead of the Structure
Imagine BTC suddenly moves 0.5% upward on the 1-minute chart.
A beginner might immediately think:
“Bitcoin is going up. I need to enter.”
But price direction on one short timeframe does not automatically define the larger trend.
Before reacting, ask:
Where is this move happening?
Is price moving into resistance?
Is it breaking an important structure?
Is it simply a short-term bounce?
Or is it part of a larger trend?
Those questions are often more useful than simply asking whether the latest candle is green or red.
Final Takeaway
There is no universal “best” timeframe in crypto trading.
The 1M chart can provide precision.
The 15M chart can provide short-term structure.
The 1H chart can provide broader intraday context.
The 4H chart can help you understand larger market structure.
The real skill is learning how these timeframes connect.
Don't let the smallest timeframe decide the biggest picture.
What timeframe do you personally use the most — 1M, 15M, 1H, or 4H?
Share your answer below. Let's compare how different traders read the same market.