
Crypto markets can move slowly for hours or even days—and then suddenly, one candle changes everything.
That is exactly what happened with Synapse (SYN).
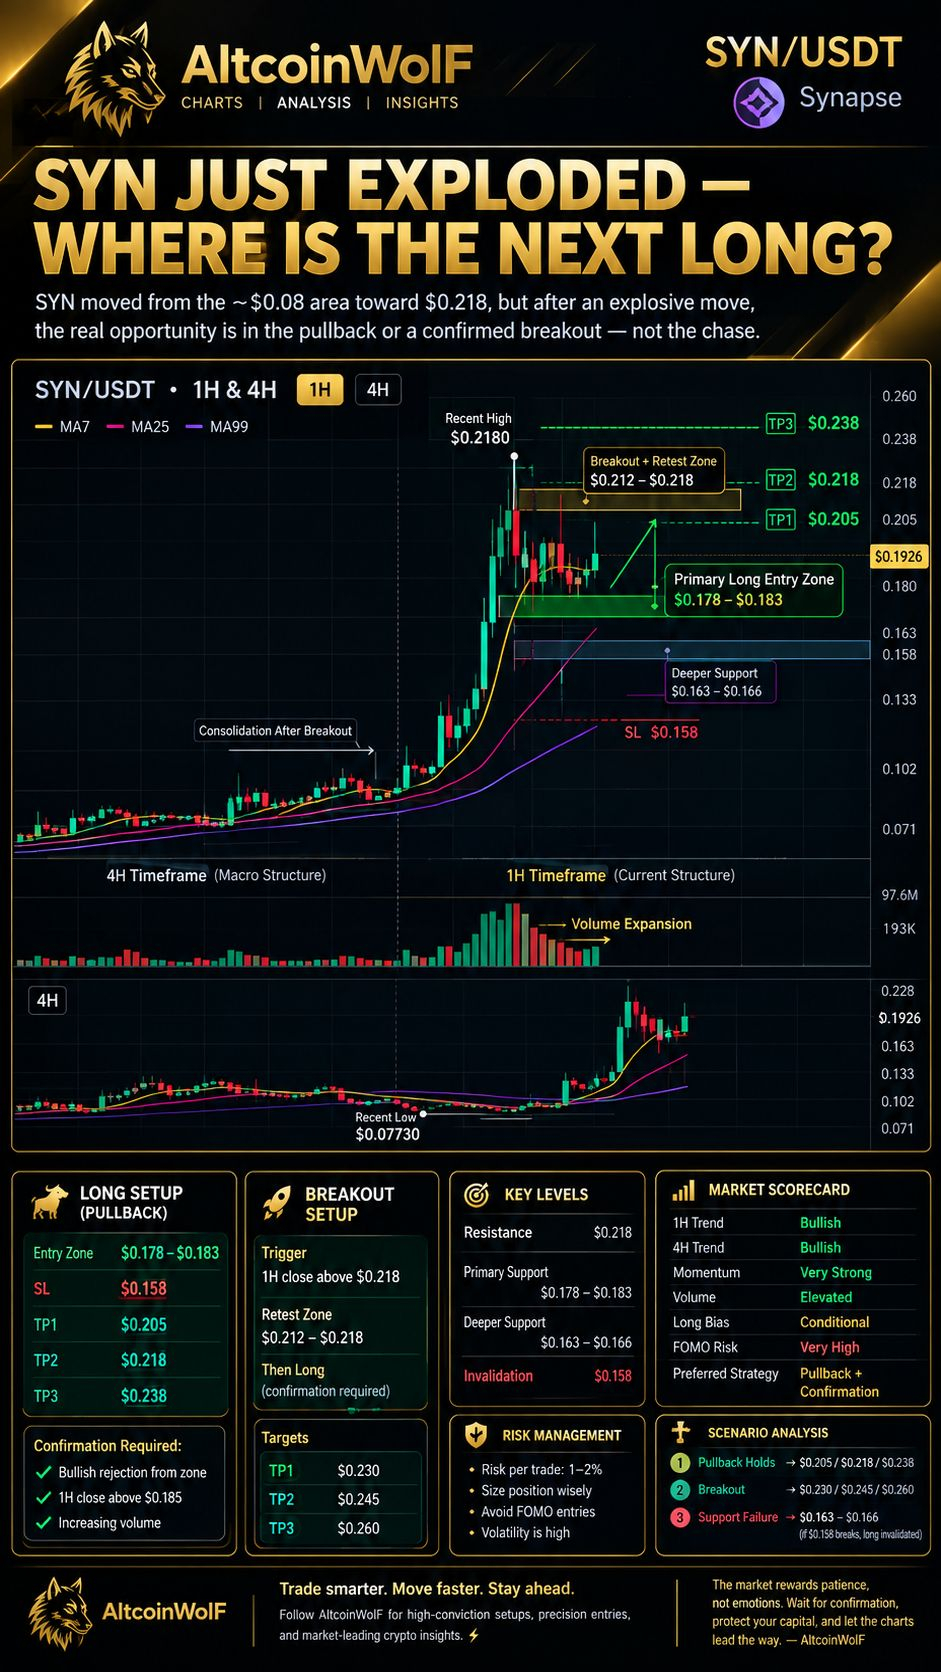
On the charts provided for today's analysis, SYN moved from the ~$0.08 area to a 24-hour high around $0.218, while the displayed price was around $0.1926. The move has been accompanied by a dramatic increase in volume.
The important question now isn't:
“How high can SYN go?”
The better trading question is:
“Where can a controlled long setup develop after this explosive move?”
That distinction matters.
SYN is associated with Synapse, a cross-chain interoperability protocol designed to facilitate communication and asset transfers across blockchain ecosystems. �
Forbes
Today, however, we're focusing on the price structure, not making a long-term fundamental valuation call.
🐺 Premium Education Post: Never Confuse Momentum With an Entry
One of the most common mistakes after a major altcoin breakout is buying simply because the chart is green.
A coin moving +100% or more can look extremely bullish—but that doesn't automatically mean the current price is a good entry.
There are two different concepts:
Momentum
Momentum tells us buyers are aggressively moving price.
Entry Quality
Entry quality asks whether the trader can define:
Where to enter
Where the setup becomes invalid
Where profits can be taken
How much capital is at risk
SYN currently has strong momentum, but that does not mean we need to chase it.
The AltcoinWolF approach is:
Momentum → Pullback → Confirmation → Entry
Not:
Pump → FOMO → Entry
SYN/USDT Technical Market Analysis
1H Structure
The 1H chart shows a powerful bullish expansion.
Current chart readings:
Price: ~$0.1926
24H High: $0.2180
1H MA7: $0.18008
1H MA25: $0.12686
1H MA99: $0.09225
The moving-average structure is strongly bullish.
Price remains above all three moving averages, while MA7 is significantly above MA25 and MA99.
That confirms strong short-term momentum.
However, there is another side to the chart.
After touching $0.218, price pulled back and began consolidating around the $0.18–$0.20 region.
That is exactly where patience becomes important.
4H Structure
The 4H chart provides an even clearer picture.
Key readings:
4H MA7: $0.13688
4H MA25: $0.09615
4H MA99: $0.09087
Recent low: approximately $0.07730
Recent high: $0.2180
The move from ~$0.077 to ~$0.218 represents a major expansion.
The 4H moving-average structure is also bullish, but the distance between current price and the moving averages shows how extended the move has become.
That means a pullback would not automatically mean the bullish structure has failed.
It could simply mean the market is attempting to establish a new support area after the breakout.
🔥 Key Levels to Watch
Resistance
$0.218
This is the immediate breakout level and recent chart high.SYN/USDT Just Exploded 137% — But Where Is the Next High-Conviction Long?
A sustained move above this level would put the market into price discovery relative to the displayed chart structure.
Near Support
$0.178–$0.183
This is our primary pullback area.
It also sits around the 1H MA7 region, making it an important short-term area to watch.
Deeper Support
$0.163–$0.166
If the first support zone fails, this becomes the next important reaction area.
Major Invalidation Area
$0.158
A decisive move below this level would invalidate the primary long setup described below.
🐺 Premium Trade Setup — LONG ONLY
Setup A: Pullback Long
Preferred Entry Zone:
🟢 $0.178–$0.183
Stop Loss:
🔴 $0.158
Take Profit Levels:
TP1: $0.205
TP2: $0.218
TP3: $0.238
Confirmation Required
Do not automatically buy simply because price touches $0.180.
We want to see evidence that buyers are defending the zone.
Possible confirmation:
Bullish rejection from $0.178–$0.183
Strong 15m/1H bullish candle
Reclaim of approximately $0.185
Improving buying volume
The setup becomes considerably weaker if price slices through the zone with strong selling volume.
🚀 Setup B: Breakout + Retest
There is another possible long scenario.
If SYN continues higher without giving the preferred pullback, don't chase the breakout candle.
Instead:
Trigger
1H close above $0.218
Then Watch
$0.212–$0.218 retest
If the old resistance becomes support and bullish confirmation appears, the breakout-retest structure can become a separate long setup.
Targets
TP1: $0.230
TP2: $0.245
TP3: $0.260
Again:
Breakout → Retest → Confirmation → Long
Not:
Breakout candle → FOMO → Long
⚠️ Confirmation & Invalidation
Bullish Confirmation
The setup becomes stronger if:
$0.178–$0.183 holds
Buyers defend the pullback
Price reclaims $0.185+
Volume expands on the bounce
1H structure creates a higher low
Bearish Invalidation
If SYN decisively loses:
$0.158
the primary pullback-long setup is invalidated.
If price instead loses $0.163–$0.166 but quickly recovers, traders can reassess the structure rather than automatically abandoning the broader bullish trend.
💰 Risk Management
At an average entry around $0.1805 with a $0.158 stop:
Approximate risk per unit is $0.0225.
That means position size should be determined from the amount of capital you are actually willing to lose—not from how attractive the target looks.
For example:
Account risk × position sizing = controlled exposure
Avoid oversized positions simply because SYN has strong momentum.
And because this token has just experienced an unusually large expansion, volatility can be significantly higher than normal.
📊 AltcoinWolF Market Scorecard
Factor
Reading
1H Trend
🟢 Bullish
4H Trend
🟢 Bullish
Momentum
🔥 Very Strong
Volume
🔥 Elevated
Immediate Resistance
$0.218
Primary Support
$0.178–$0.183
Deeper Support
$0.163–$0.166
Long Bias
🟢 Conditional
FOMO Risk
🔴 Very High
Preferred Strategy
Pullback + Confirmation
External market data also reflects the unusually large move in SYN today; one September 16 report recorded a gain above 120% over 24 hours and identified ~$0.21 as nearby resistance, while CoinGecko was showing elevated trading volume. �
Coin Gabbar +1
🔮 Scenario Analysis
🟢 Scenario 1 — Pullback Holds
SYN returns toward $0.178–$0.183, buyers defend the zone, and price reclaims $0.185+.
Focus: Long confirmation.
Potential targets:
$0.205 → $0.218 → $0.238
🟢 Scenario 2 — Breakout
SYN closes above $0.218 on the 1H timeframe.
Instead of chasing, wait for a retest around $0.212–$0.218.
If that zone becomes support, the next upside levels are:
$0.230 → $0.245 → $0.260
🔴 Scenario 3 — Support Failure
SYN loses the primary support zone and selling pressure increases.
Watch:
$0.163–$0.166
If the market continues lower and decisively loses $0.158, the current long thesis is invalidated.
🧠 The Real Lesson From SYN
The biggest lesson today isn't a target.
It's trade selection.
A trader doesn't need to participate in every candle.
Sometimes the highest-quality decision is simply:
“Not yet.”
SYN has already demonstrated that buyers are capable of moving the market aggressively.
Our job isn't to predict the next candle.
Our job is to define the conditions under which a trade makes sense.
That means:
Wait for the zone.
Wait for confirmation.
Define the invalidation.
Protect the capital.
🐺 Final Call
SYN/USDT has an exceptionally strong bullish structure on the charts provided, but the magnitude of the recent expansion makes chasing the current price unattractive from a risk-management perspective.
The primary AltcoinWolF setup remains:
🟢 $0.178–$0.183 Pullback Zone
🎯 TP1 $0.205
🎯 TP2 $0.218
🎯 TP3 $0.238
🛑 SL $0.158
Confirmation is mandatory.
Alternative:
🚀 1H close above $0.218 → retest $0.212–$0.218 → confirmation → long consideration.
No setup is guaranteed, and this is market analysis—not a promise of profit. Always size positions according to your own risk tolerance and do your own analysis.
#FedRateWatch #SYN #MSTRTradingVolumeSurpassesMorganStanley #altcoinwolf #CircleOpensArcMainnet $SYN