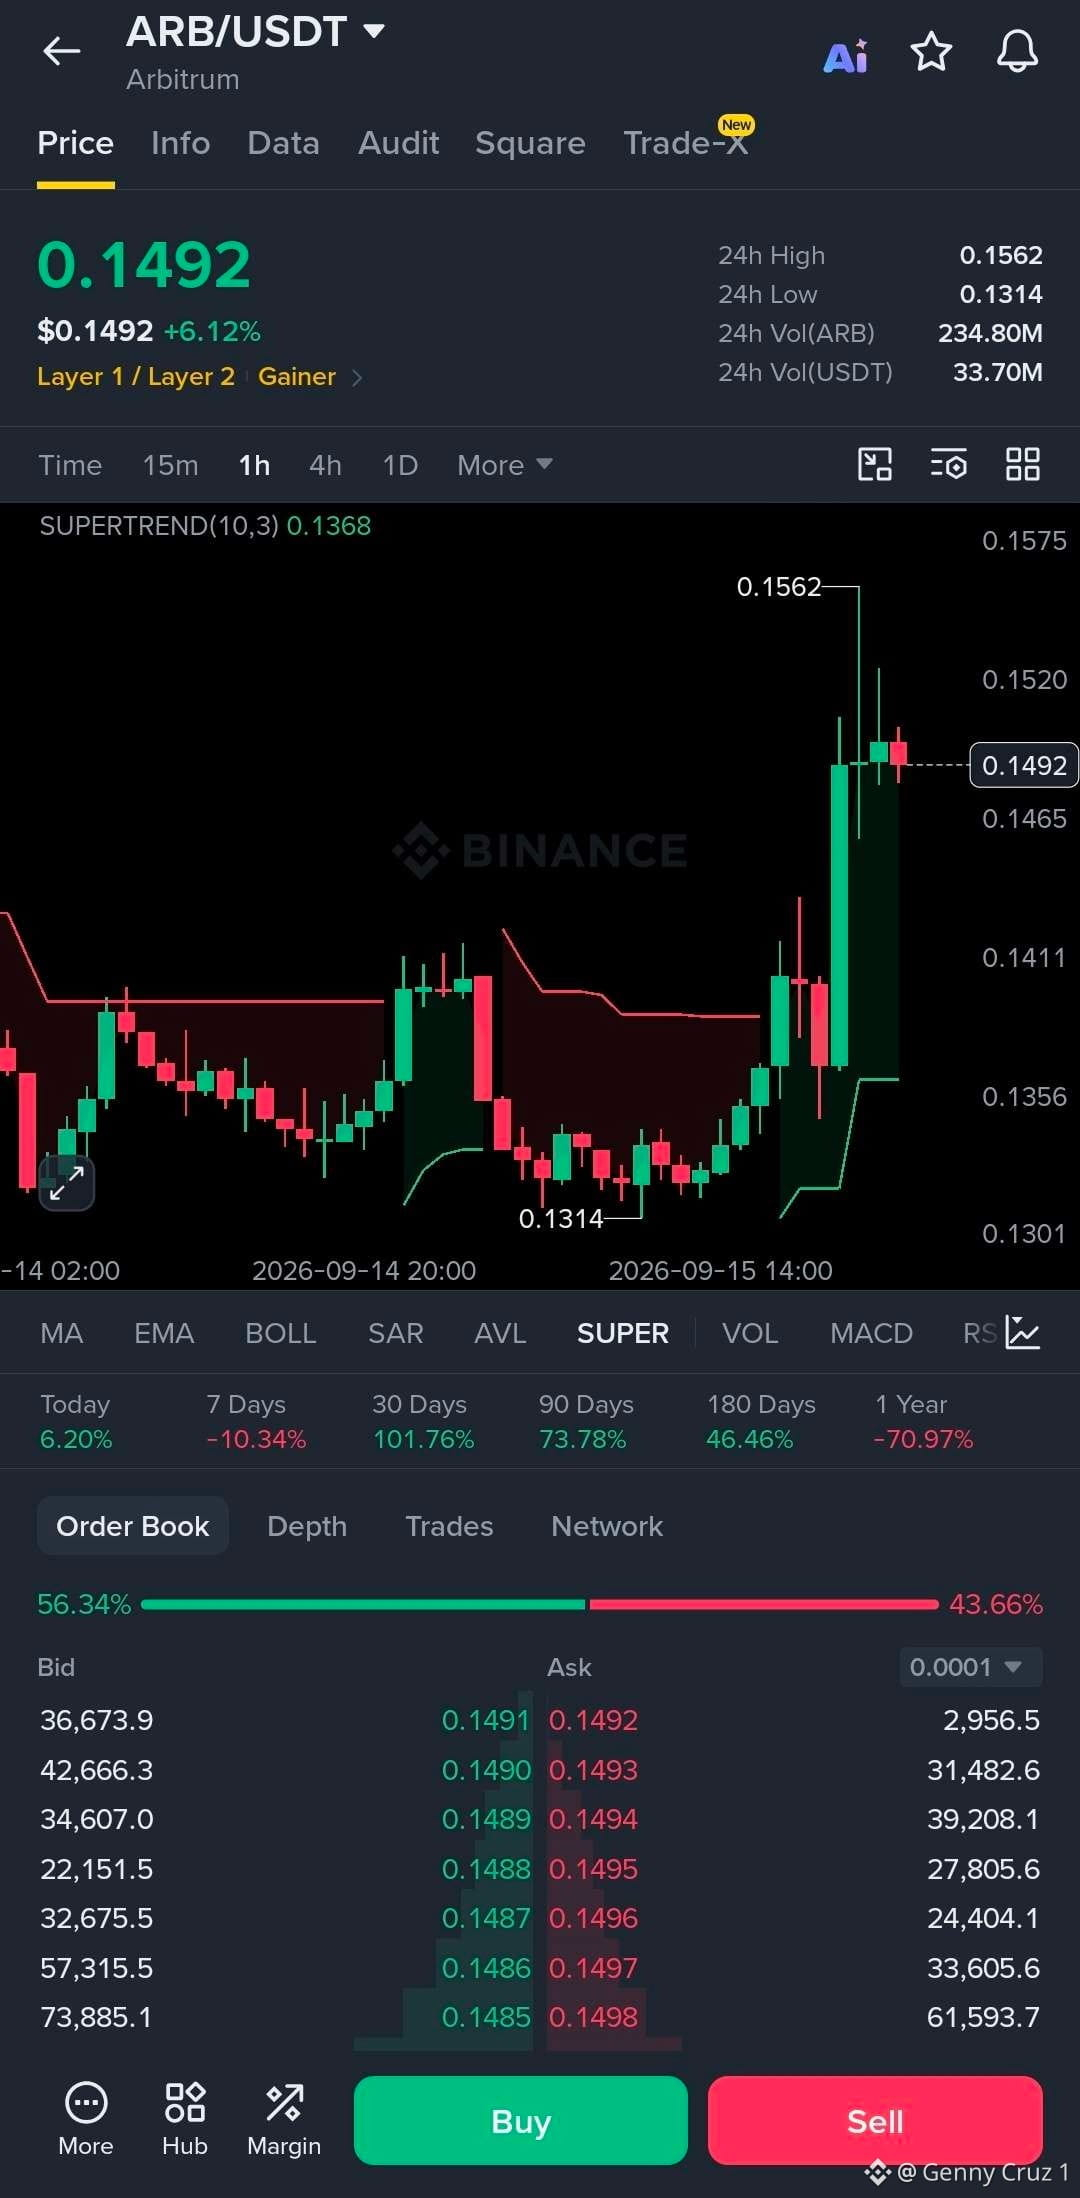
$ARB — 1H Chart Read 📊
This is a much healthier recovery structure than ARB had earlier. Price bounced hard from $0.1314, reclaimed the Supertrend at $0.1368, and then pushed straight into the $0.1562 resistance.
The move is strong, but I wouldn’t chase the current candle. ARB has already covered a lot of ground, and the latest candle is showing some hesitation near the highs.
Key levels
Resistance: $0.1520 → $0.1562
Breakout: $0.1562
First support: $0.1465
Major support: $0.1410
Supertrend: $0.1368
Major swing low: $0.1314
Long setup
Entry: $0.1465–$0.1480
SL: $0.1405
TP1: $0.1520
TP2: $0.1562
TP3: $0.1600–$0.1630
The better trade here is waiting for the pullback. If $0.1465 holds and buyers step back in, the structure remains nicely bullish.
If ARB gets a clean 1H close above $0.1562, that would be the confirmation I’d want for another leg higher.
One thing I like from your screenshot: the order book is currently 56.34% bids vs 43.66% asks, so buyers still have a slight edge. But the real test is whether they can absorb the supply around $0.152–$0.156.
Bias: Bullish above $0.1410, stronger continuation above $0.1562.
Recent market data also shows ARB has been moving with unusually high volatility, so respecting these pullback levels matters more than chasing the green candles.
#ARB
This is a much healthier recovery structure than ARB had earlier. Price bounced hard from $0.1314, reclaimed the Supertrend at $0.1368, and then pushed straight into the $0.1562 resistance.
The move is strong, but I wouldn’t chase the current candle. ARB has already covered a lot of ground, and the latest candle is showing some hesitation near the highs.
Key levels
Resistance: $0.1520 → $0.1562
Breakout: $0.1562
First support: $0.1465
Major support: $0.1410
Supertrend: $0.1368
Major swing low: $0.1314
Long setup
Entry: $0.1465–$0.1480
SL: $0.1405
TP1: $0.1520
TP2: $0.1562
TP3: $0.1600–$0.1630
The better trade here is waiting for the pullback. If $0.1465 holds and buyers step back in, the structure remains nicely bullish.
If ARB gets a clean 1H close above $0.1562, that would be the confirmation I’d want for another leg higher.
One thing I like from your screenshot: the order book is currently 56.34% bids vs 43.66% asks, so buyers still have a slight edge. But the real test is whether they can absorb the supply around $0.152–$0.156.
Bias: Bullish above $0.1410, stronger continuation above $0.1562.
Recent market data also shows ARB has been moving with unusually high volatility, so respecting these pullback levels matters more than chasing the green candles.
#ARB