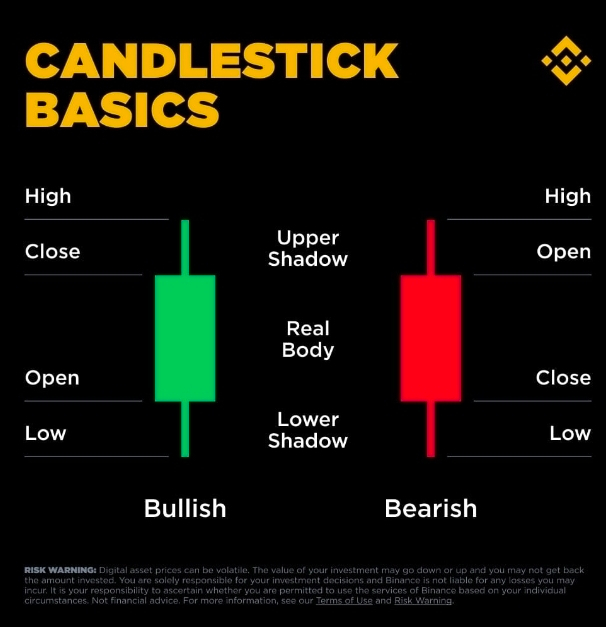
Every candle tells a 4-part price story.
High: Maximum price level reached
Open: Price level where candle started
Close: Price level where candle ended
Low: Minimum price level reached
CANDLE STRUCTURE
Real Body: Space between Open and Close.
Upper Shadow (Wick): Price rejection towards the High.
Lower Shadow (Wick): Price rejection towards the Low.
THE TWO DIRECTIONAL STATES
🟢 Bullish Candle (Green): Close > Open (Buyers in control)
🔴 Bearish Candle (Red): Close < Open (Sellers in control)
Social Post Caption
Every single candlestick on your chart tracks market action using four data points: Open, High, Low, and Close (OHLC).
Key Anatomy Breakdown:
Real Body: Shows the net distance between where price opened and where it closed during the timeframe.
Shadows (Wicks): Show how far price swung in both directions before being pushed back by buyers or sellers.
Bullish (Green): Price closed higher than it opened.
Bearish (Red): Price closed lower than it opened.
#CanadaOSFISaysTokenizedDepositsEqualTraditionalDeposits #SECReceivesGrayscaleLitecoinTrustETFFiling #ClarityActFacesProceduralVoteSept15