Tonight I'll tell everyone a ghost story
I saw a S&P 500 theory on the internet before
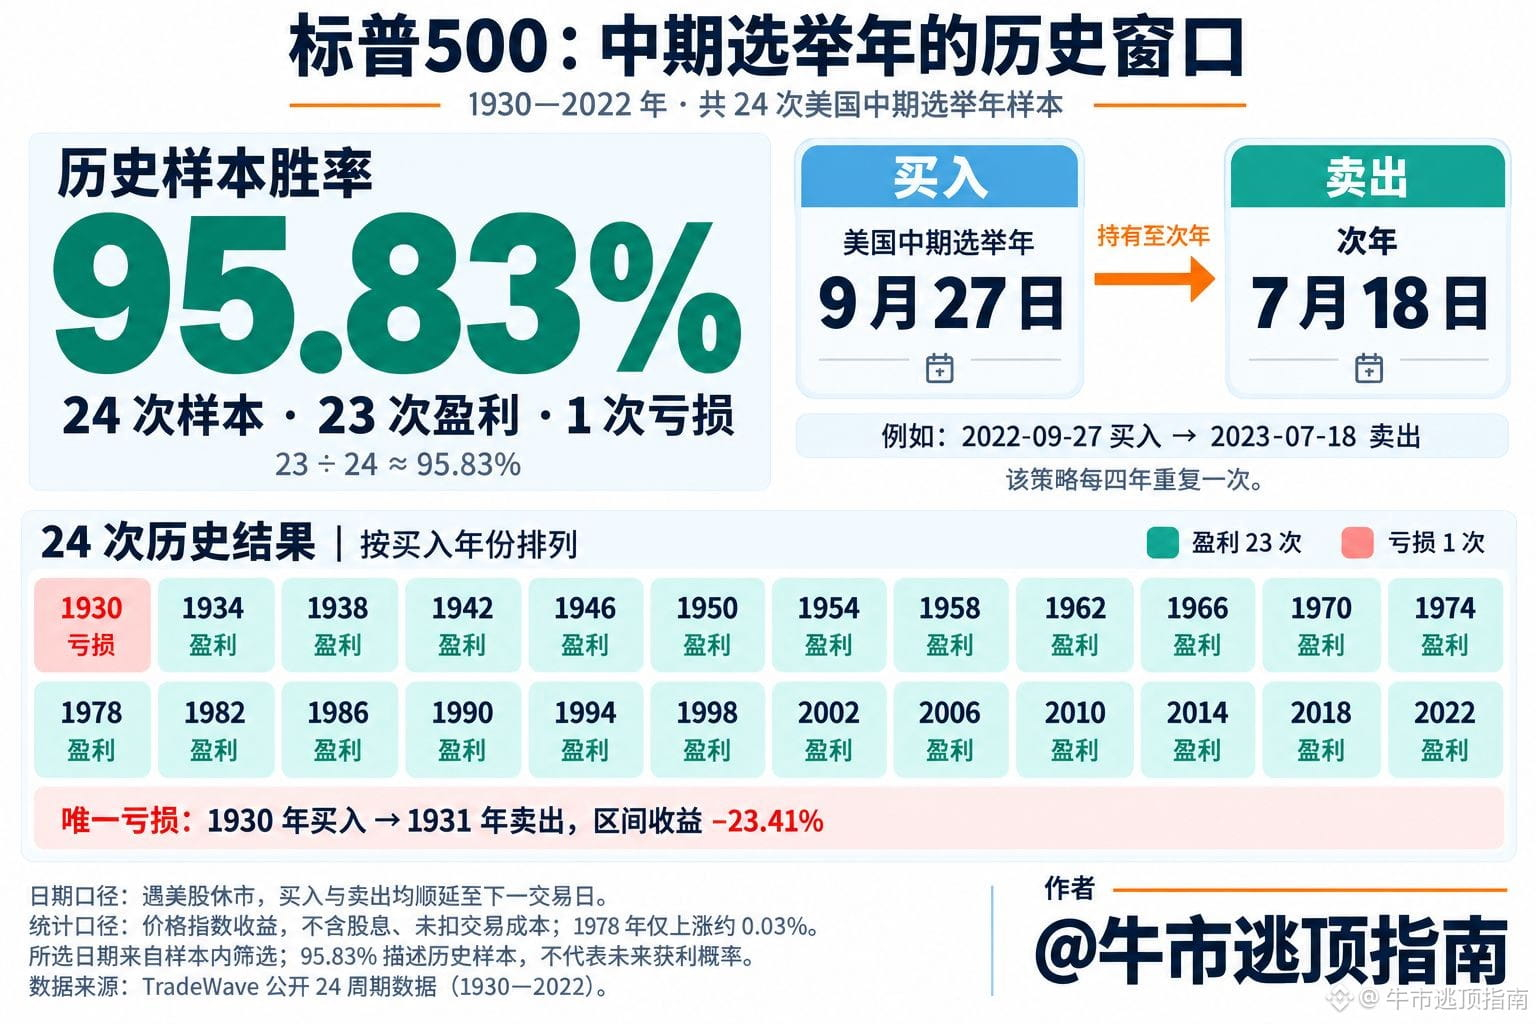
Roughly speaking, in the U.S. midterm election year, buy the S&P 500 on September 27, and hold it until July 18 the following year. From 1930 to 2022, it has occurred 24 times—23 times profitable and once losing, with a win rate as high as 95.8%!!! And the only time it lost was in the Great Depression of 1930! (see Figure 1)
Then I started thinking—compared to this, what would the data for “big pie” (I think it refers to Bitcoin) be like during the same period? So I went and looked up the data
The “big pie” data has 4 times. Excluding the early 2010 instance, the other times are:
2014–2015: −25.18%
2018–2019: +59.93%
2022–2023: +56.15%
It’s clearly not very impressive in the same cycle; it even looks quite weak
So I went further and analyzed under what conditions the “big pie” can show extremely strong dominance?
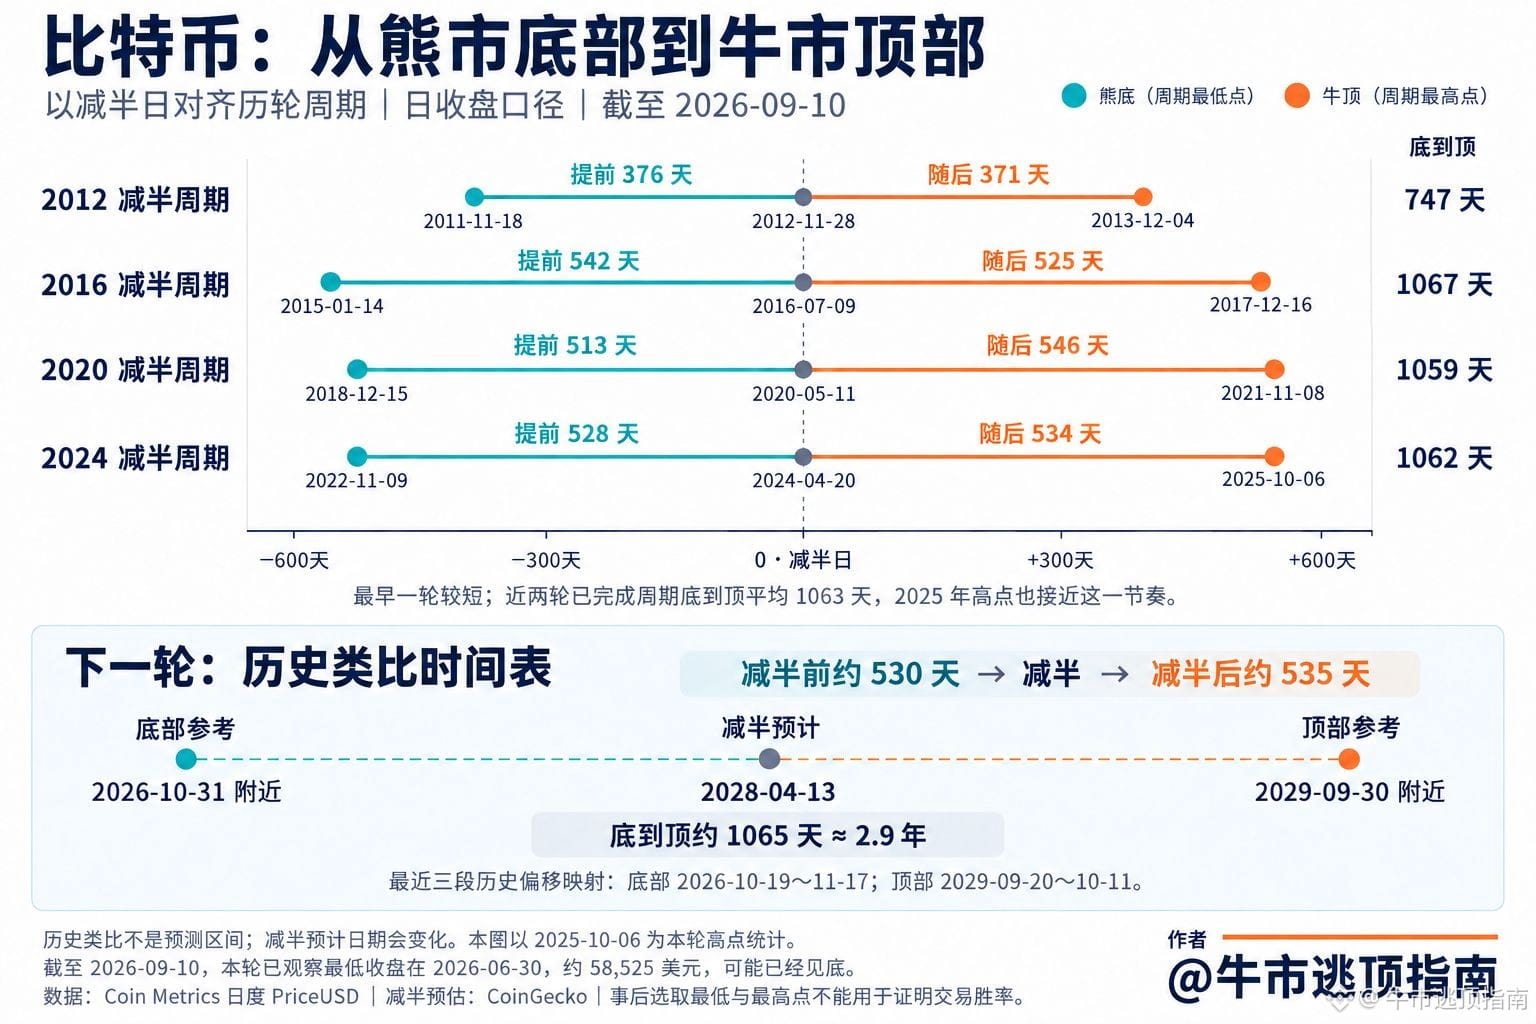
The result came out. You can see Figure 2, and I found some shocking patterns
All four times are from the bottom of the bear market to the top of the bull market—the period that maximizes returns. And this return is the maximized gain in each cycle
From the time dimension, besides the early “big pie” one, roughly it’s from 370 days before the halving to 370 days after the halving
The other three times reach the bear market bottom about 530 days before the halving, and then reach the bull market top 535 days after the halving!!!
So if we follow this rule and trace it further back, the most recent window period is about to arrive!
The next halving is expected to be around April 13, 2028, so the 530 days before the halving is around October 31, 2026!!!
Finally, I want to say something—although I know myself that endlessly retracing the past is actually a very stupid approach, and it’s not like I’m telling you that on October 31 you absolutely must go all-in on “big pie”
But it shows something特别有意思的事情
The market looks like random disorderly fluctuations every day
But if you stretch time out for decades, you’ll see
policy cycles, capital cycles, sentiment cycles, and time cycles
really leave repeating traces.