🔥 $NFLXB LXB/USDT Technical Analysis: Is a Recovery Rally Loading? 📈
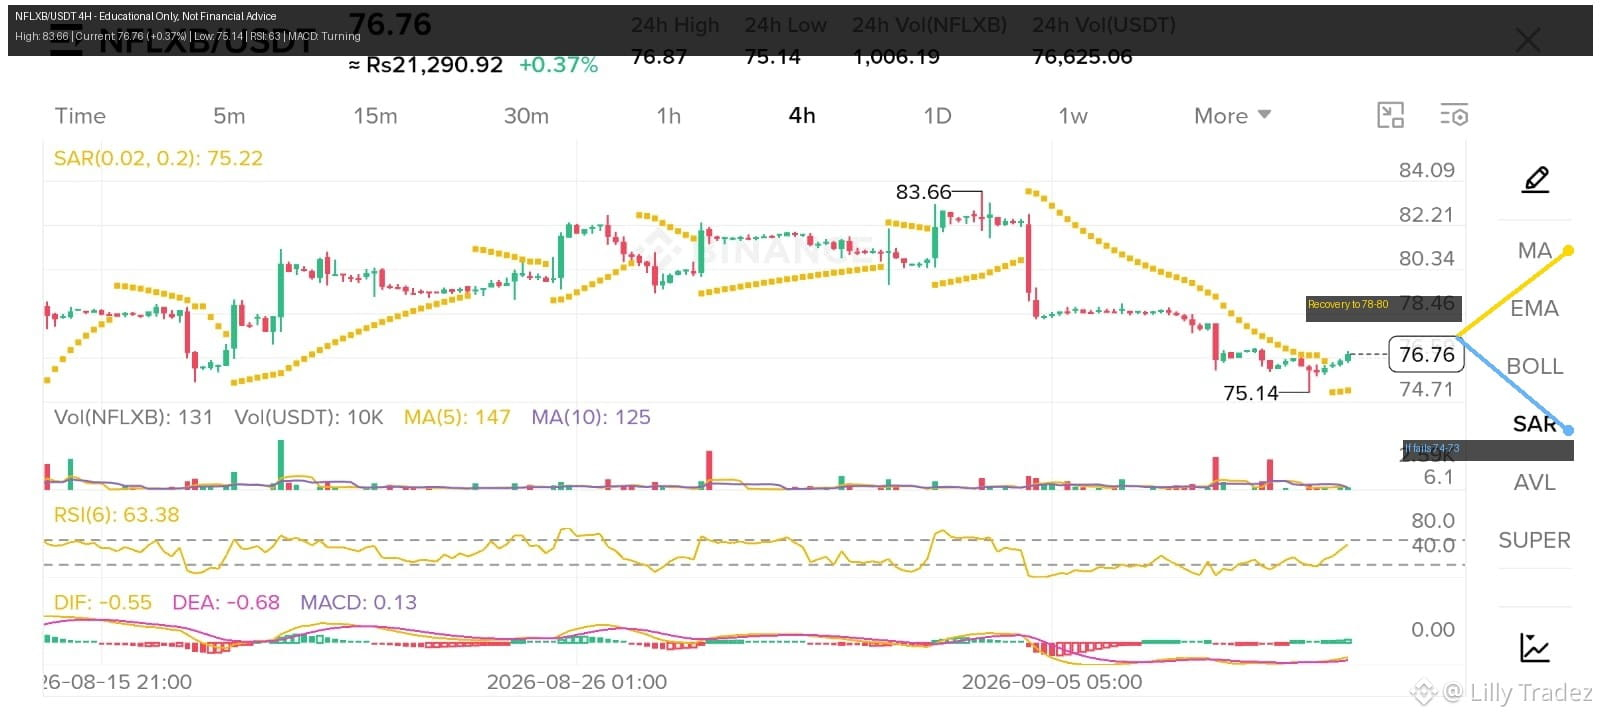
After a sharp pullback from the peak of 83.66, $NFLXB found strong support around the 75.14 level. The chart is now showing early signs of potential stabilization and consolidation!
📊 Key Technical Levels & Indicators:
Current Price: 76.76
Immediate Support Zone: 74.71 – 75.14
Recovery Target Zone: 78.00 – 80.00
RSI (6): Sitting at 63.38, indicating steady buying momentum returning on lower timeframes.
MACD: Forming a positive crossover with DIF at -0.55, DEA at -0.68, and a green histogram (+0.13), signaling a potential trend shift.
💡 Market Outlook:
If $NFLXB holds above the 75.00 major support zone, we could see a steady recovery back toward the 78.46 - 80.34 resistance region. Keep an eye on the volume confirmation!
⚠️ Educational content only. Always manage your risk and DYOR!
After a sharp pullback from the peak of 83.66, $NFLXB found strong support around the 75.14 level. The chart is now showing early signs of potential stabilization and consolidation!
📊 Key Technical Levels & Indicators:
Current Price: 76.76
Immediate Support Zone: 74.71 – 75.14
Recovery Target Zone: 78.00 – 80.00
RSI (6): Sitting at 63.38, indicating steady buying momentum returning on lower timeframes.
MACD: Forming a positive crossover with DIF at -0.55, DEA at -0.68, and a green histogram (+0.13), signaling a potential trend shift.
💡 Market Outlook:
If $NFLXB holds above the 75.00 major support zone, we could see a steady recovery back toward the 78.46 - 80.34 resistance region. Keep an eye on the volume confirmation!
⚠️ Educational content only. Always manage your risk and DYOR!