#BTC $#BTC $Bitcoin (BTC) Market Analysis — Based on the Chart
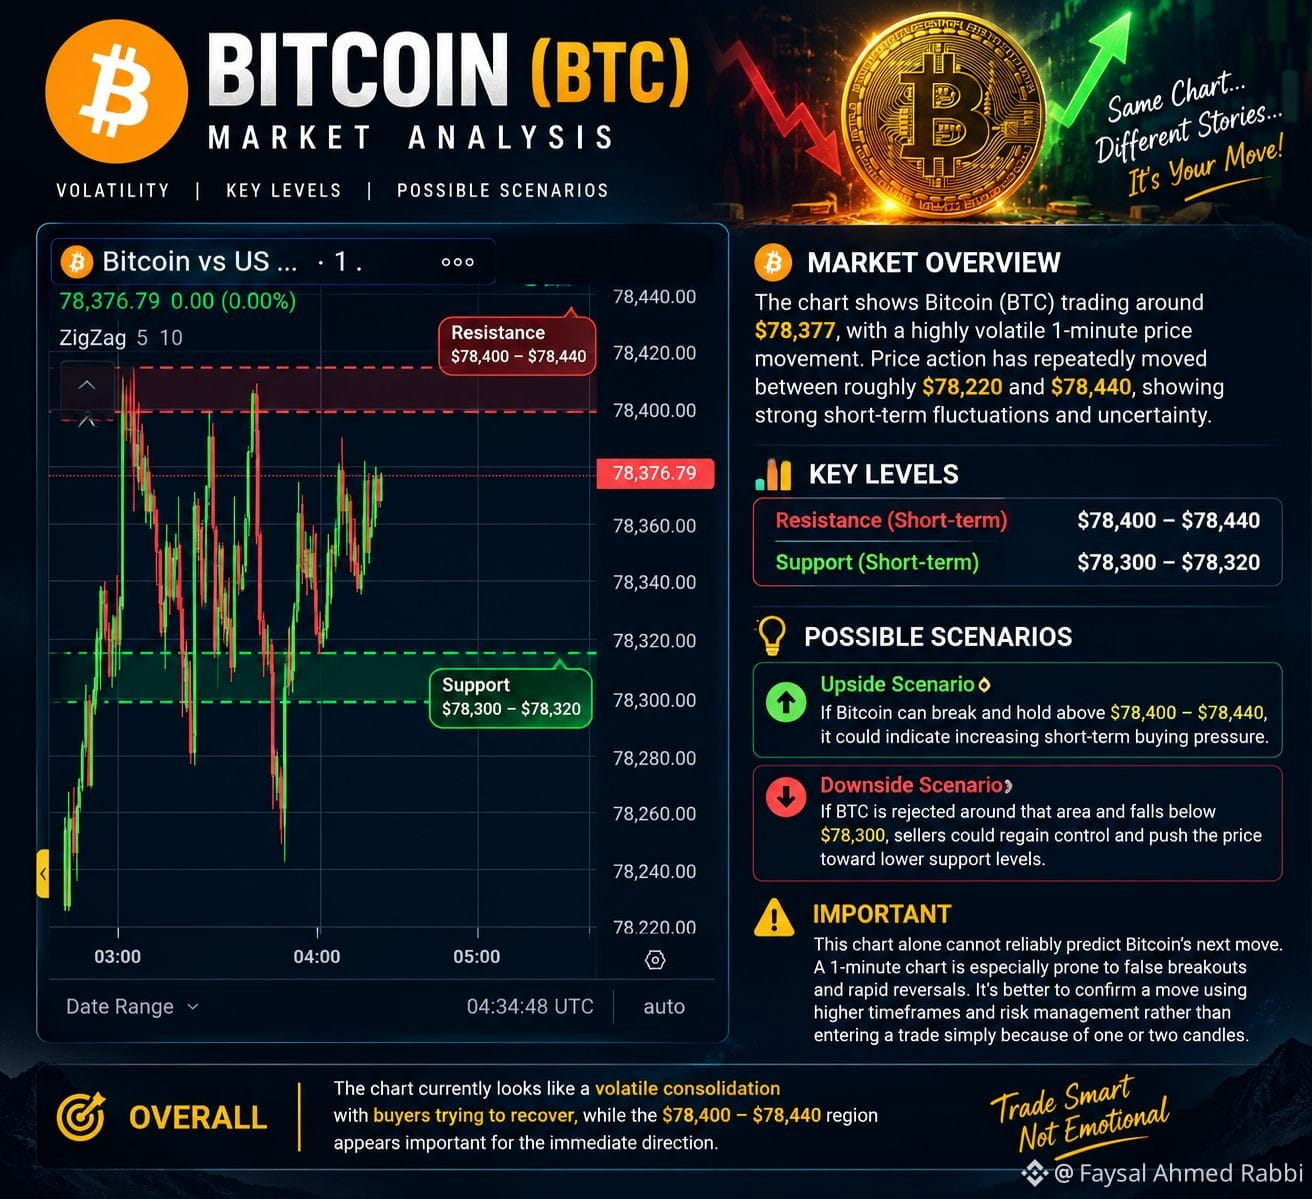
The chart shows Bitcoin (BTC) trading around $78,377, with a highly volatile 1-minute price movement. Price action has repeatedly moved between roughly $78,220 and $78,440, showing strong short-term fluctuations and uncertainty.
📊 What the chart suggests
Current price: around $78,377
Short-term resistance: approximately $78,400–$78,440
Short-term support: approximately $78,300–$78,320
The recent candles show buyers attempting to push BTC upward, but sellers are still active near the higher levels.
The chart's 1-minute timeframe is very noisy, so individual candles can change direction quickly.
🔎 Possible scenarios
If Bitcoin can break and hold above $78,400–$78,440, it could indicate increasing short-term buying pressure.
On the other hand, if BTC is rejected around that area and falls below $78,300, sellers could regain control and push the price toward lower support levels.
⚠️ Important
This chart alone cannot reliably predict Bitcoin's nex$t move. A 1-minute chart is especially prone to false breakouts and rapid reversals. It's better to confirm a move using higher timeframes and risk management rather than entering a trade simply because of one or two candles.
Overall: The chart currently looks like a volatile consolidation with buyers trying to recover, while the $78,400–$78,440 region appears important for the immediate direction.
The chart shows Bitcoin (BTC) trading around $78,377, with a highly volatile 1-minute price movement. Price action has repeatedly moved between roughly $78,220 and $78,440, showing strong short-term fluctuations and uncertainty.
📊 What the chart suggests
Current price: around $78,377
Short-term resistance: approximately $78,400–$78,440
Short-term support: approximately $78,300–$78,320
The recent candles show buyers attempting to push BTC upward, but sellers are still active near the higher levels.
The chart's 1-minute timeframe is very noisy, so individual candles can change direction quickly.
🔎 Possible scenarios
If Bitcoin can break and hold above $78,400–$78,440, it could indicate increasing short-term buying pressure.
On the other hand, if BTC is rejected around that area and falls below $78,300, sellers could regain control and push the price toward lower support levels.
⚠️ Important
This chart alone cannot reliably predict Bitcoin's nex$t move. A 1-minute chart is especially prone to false breakouts and rapid reversals. It's better to confirm a move using higher timeframes and risk management rather than entering a trade simply because of one or two candles.
Overall: The chart currently looks like a volatile consolidation with buyers trying to recover, while the $78,400–$78,440 region appears important for the immediate direction.