[September 9 Bitcoin chart analysis]
*My analysis is optimized for TradingView.
If you press the replay button, you can check real-time movements.
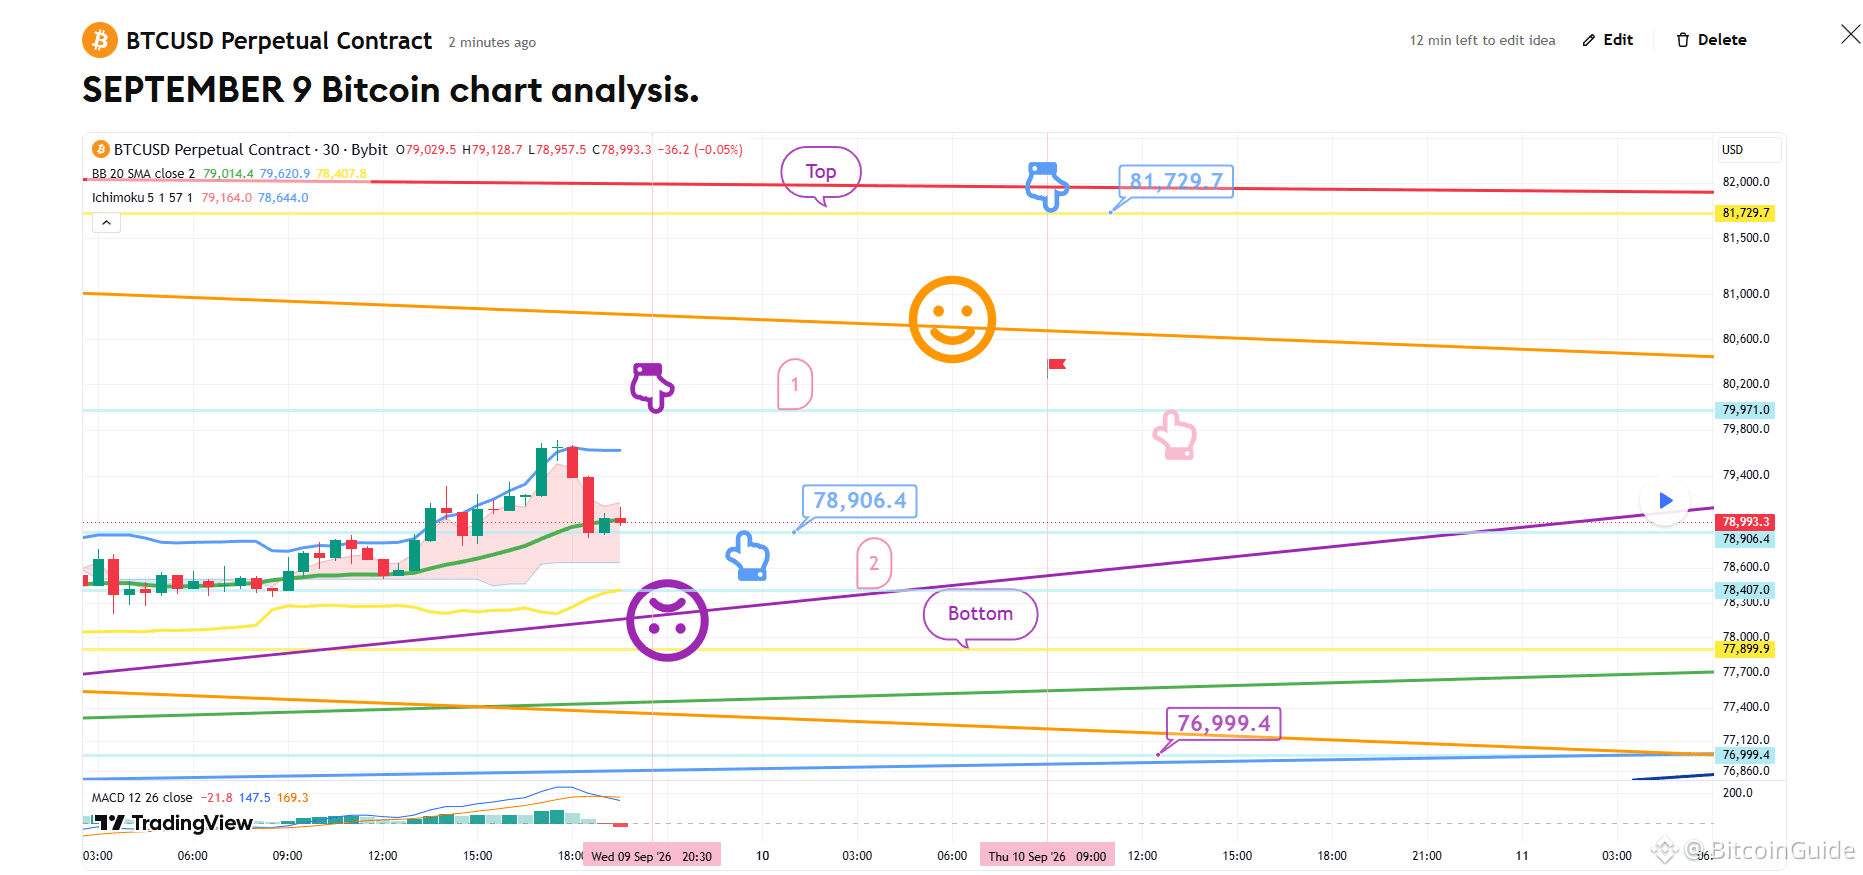
This is the Bitcoin 30-minute chart.
Since the overall medium-term pattern has broken down,
we may see significant volatility in both directions.
*A neutral strategy (trading both directions)
applied around the "Purple Finger 1" zone at the top:
1) After confirming a touch of the Purple Finger 1 zone at $79,791 (consider a short position),
look to enter a long position at the lower level marked by the light blue finger ($78,906.4).
/ Stop-loss if the purple support line is breached.
2) Switch to a short position at $81,729.7 / Stop-loss if the red resistance line is broken.
This also serves as the final zone to re-enter a long position.
3) If the price drops immediately without touching the 1 zone at the top,
the "Zone 2" level at $78.4K is the final waiting point for a long position.
The stop-loss condition (if the purple support line is breached) remains the same.
Once the purple support line is breached,
the price could drop to the "Bottom" level marked below—potentially as low as $76.9K—
so please exercise caution.
If the light blue support line at $76.9K is broken,
the medium-term bullish channel will be invalidated, which is unfavorable for long positions.
I post the analysis results as a Comment every day.
Thank you.
(You can find the link on my profile.)
- Click Follow to receive faster information every day.
- Check the results using the replay button on TradingView.
#Crypto# #BTC Price Analysis# #Altcoin Season# #BNBChain# #ㅠㅆ
*My analysis is optimized for TradingView.
If you press the replay button, you can check real-time movements.
This is the Bitcoin 30-minute chart.
Since the overall medium-term pattern has broken down,
we may see significant volatility in both directions.
*A neutral strategy (trading both directions)
applied around the "Purple Finger 1" zone at the top:
1) After confirming a touch of the Purple Finger 1 zone at $79,791 (consider a short position),
look to enter a long position at the lower level marked by the light blue finger ($78,906.4).
/ Stop-loss if the purple support line is breached.
2) Switch to a short position at $81,729.7 / Stop-loss if the red resistance line is broken.
This also serves as the final zone to re-enter a long position.
3) If the price drops immediately without touching the 1 zone at the top,
the "Zone 2" level at $78.4K is the final waiting point for a long position.
The stop-loss condition (if the purple support line is breached) remains the same.
Once the purple support line is breached,
the price could drop to the "Bottom" level marked below—potentially as low as $76.9K—
so please exercise caution.
If the light blue support line at $76.9K is broken,
the medium-term bullish channel will be invalidated, which is unfavorable for long positions.
I post the analysis results as a Comment every day.
Thank you.
(You can find the link on my profile.)
- Click Follow to receive faster information every day.
- Check the results using the replay button on TradingView.
#Crypto# #BTC Price Analysis# #Altcoin Season# #BNBChain# #ㅠㅆ