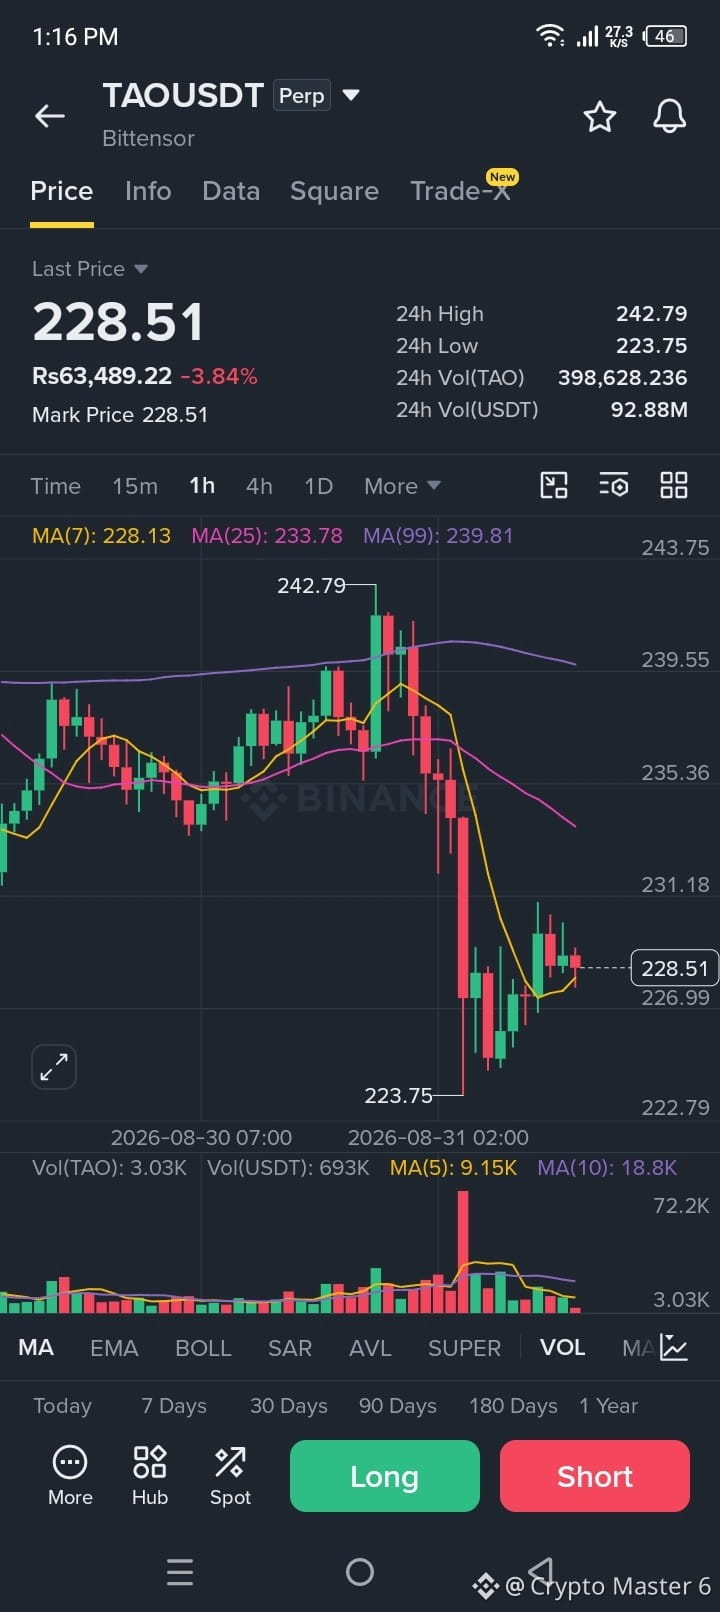
This week, the weekly chart printed a signal it hasn't shown throughout this entire run. While the current price sitting at $229 doesn't reveal it yet, the setup underneath is reaching a critical inflection point.
The most decisive level on the chart—the line that dictates the next macro leg and defines your risk—starts at the confluence of two primary technical indicators. The 200-day moving average rests at $235, sitting directly alongside the 0.382 Fibonacci retracement at $233. When two independent tools highlight the exact same shelf, it creates a definitive bull/bear line in the sand.
As long as TAO trades below this $233–$235 zone, price action remains compressed in a tight coil. A confirmed weekly close above it completely alters the structure, shifting the chart into a clean continuation pattern.
Here is what the current price is hiding
$TAO
#SKHynixStudiesJapanMemoryChipVenture #KospiDrops3.6%AsSamsungSKHynixWeaken
The most decisive level on the chart—the line that dictates the next macro leg and defines your risk—starts at the confluence of two primary technical indicators. The 200-day moving average rests at $235, sitting directly alongside the 0.382 Fibonacci retracement at $233. When two independent tools highlight the exact same shelf, it creates a definitive bull/bear line in the sand.
As long as TAO trades below this $233–$235 zone, price action remains compressed in a tight coil. A confirmed weekly close above it completely alters the structure, shifting the chart into a clean continuation pattern.
Here is what the current price is hiding
$TAO
#SKHynixStudiesJapanMemoryChipVenture #KospiDrops3.6%AsSamsungSKHynixWeaken