
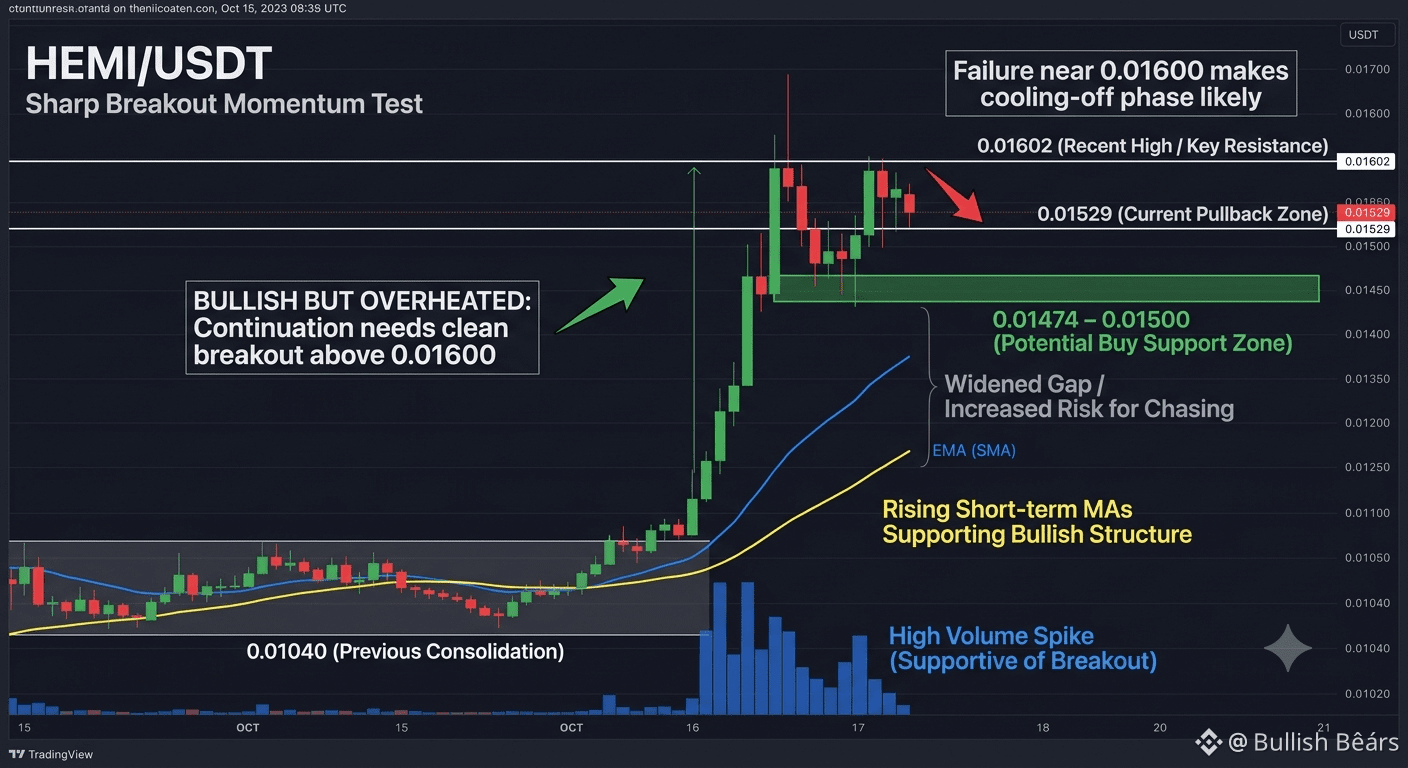
@Hemi is showing a sharp breakout, but the chart suggests momentum is now being tested rather than freely accelerating.Price moved from the 0.01040 area to a recent high near 0.01602, marking a strong upward push with noticeably higher volume.#HEMI The latest candles are pulling back around 0.01529, which makes the 0.01600 region the key level to watch. A clean move above that area could signal that buyers are still willing to extend the rally. On the other hand, repeated rejection near the high may lead to consolidation or a deeper retracement.The short-term moving averages are rising strongly and remain below the current price, supporting the bullish structure. However, the distance between price and the averages has widened quickly, so chasing the move after such a steep climb carries increased risk. $HEMI The 0.01474–0.01500 zone may become an important area for buyers to defend if the pullback continues.For now, the chart looks bullish but overheated: continuation needs a convincing breakout, while failure near 0.01600 would make a cooling-off phase more likely. This is market commentary, not financial advice.

نشر
إخلاء مسؤولية: يتضمن آراء جهات خارجية. لا تُعدّ نصيحة. يُمكن استخدام Binance AI دون أي ضمان. اطلع على الشروط والأحكام.