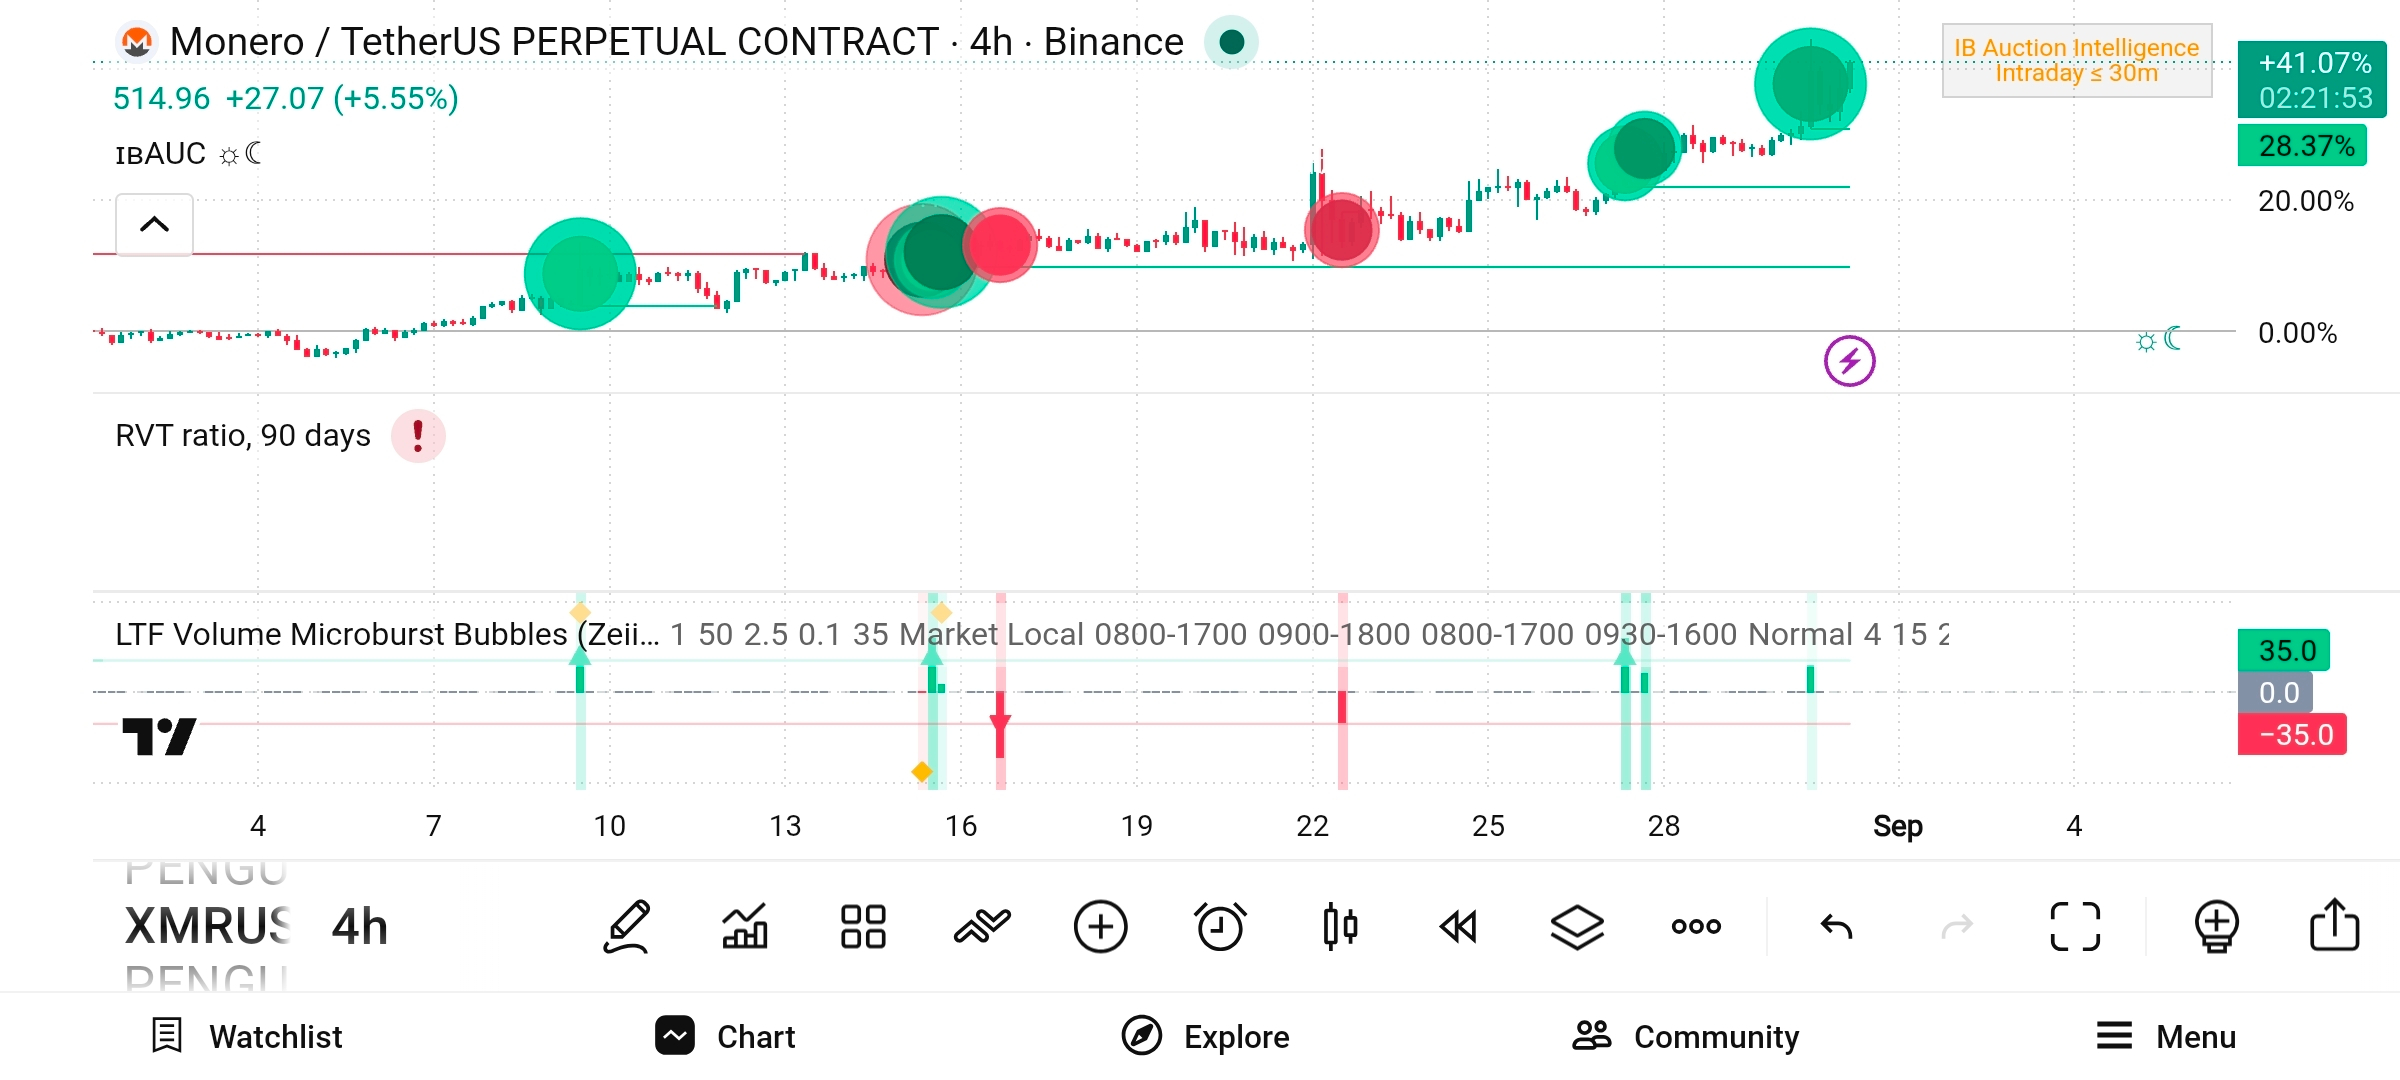

⚡ $XMR /USDT — 4H BULLISH SIGNAL ⚡
The Monero chart is heating up, and the structure is getting harder to ignore.
$XMR is trading around 514.96, up approximately 5.55%, while the 4H chart continues to print a strong sequence of higher highs and higher lows.
What caught my attention is the repeated bullish activity appearing during the latest upward move. Buyers have been stepping in after pullbacks, and price has now pushed into the 500+ zone with strong momentum.
🎯 TRADE SETUP — LONG
Entry Zone: 508 – 518
Current Price: ~514.96
TP1: 530
TP2: 545
TP3: 565
TP4: 580+
🛑 Stop Loss: 495
📊 Why I’m watching this setup:
• 4H trend remains strongly bullish
• Higher highs + higher lows are clearly visible
• Recent momentum shows aggressive buying interest
• Price is holding above previous consolidation areas
• A clean breakout above the recent high could accelerate momentum
• Pullbacks toward the entry zone may offer better risk control than chasing a vertical candle
🔥 THE IMPORTANT PART
I would not blindly chase the pump.
If $XMR holds above the 508–518 area and buyers continue defending the structure, the next expansion toward 530 → 545 → 565 becomes interesting.
But if price loses 495 with strong 4H selling pressure, the bullish setup is invalidated.
⚠️ Risk management first. Keep position size controlled and never risk more than you can afford to lose.
Setup: LONG
Bias: Bullish
Timeframe: 4H
Risk Level: Moderate
Invalidation: Below 495
XMR is moving fast — now the question is whether buyers can turn this momentum into another leg higher.
Not financial advice. DYOR.
The Monero chart is heating up, and the structure is getting harder to ignore.
$XMR is trading around 514.96, up approximately 5.55%, while the 4H chart continues to print a strong sequence of higher highs and higher lows.
What caught my attention is the repeated bullish activity appearing during the latest upward move. Buyers have been stepping in after pullbacks, and price has now pushed into the 500+ zone with strong momentum.
🎯 TRADE SETUP — LONG
Entry Zone: 508 – 518
Current Price: ~514.96
TP1: 530
TP2: 545
TP3: 565
TP4: 580+
🛑 Stop Loss: 495
📊 Why I’m watching this setup:
• 4H trend remains strongly bullish
• Higher highs + higher lows are clearly visible
• Recent momentum shows aggressive buying interest
• Price is holding above previous consolidation areas
• A clean breakout above the recent high could accelerate momentum
• Pullbacks toward the entry zone may offer better risk control than chasing a vertical candle
🔥 THE IMPORTANT PART
I would not blindly chase the pump.
If $XMR holds above the 508–518 area and buyers continue defending the structure, the next expansion toward 530 → 545 → 565 becomes interesting.
But if price loses 495 with strong 4H selling pressure, the bullish setup is invalidated.
⚠️ Risk management first. Keep position size controlled and never risk more than you can afford to lose.
Setup: LONG
Bias: Bullish
Timeframe: 4H
Risk Level: Moderate
Invalidation: Below 495
XMR is moving fast — now the question is whether buyers can turn this momentum into another leg higher.
Not financial advice. DYOR.