Everyone is staring at Bitcoin while $HEMI /USDT just printed a signal most traders won't see until it is too late.
$HEMI - 🟢 LONG · Conf 89%
Trade Plan:
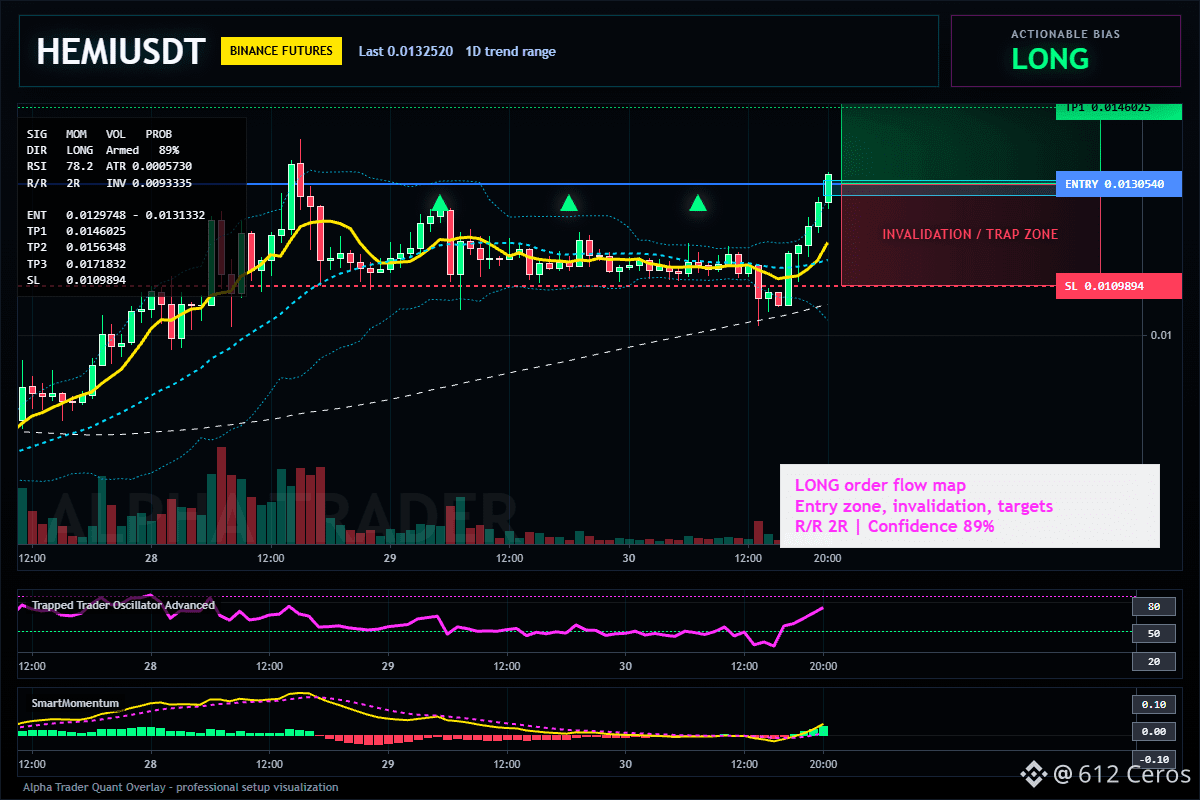
Entry: 0.0129748 – 0.0131332
SL: 0.0109894
TP1: 0.0146025
TP2: 0.0156348
TP3: 0.0171832
Why this setup?
The 4-hour chart is flashing a trend-following LONG with an 89% confidence score, but the real edge is in the timing.
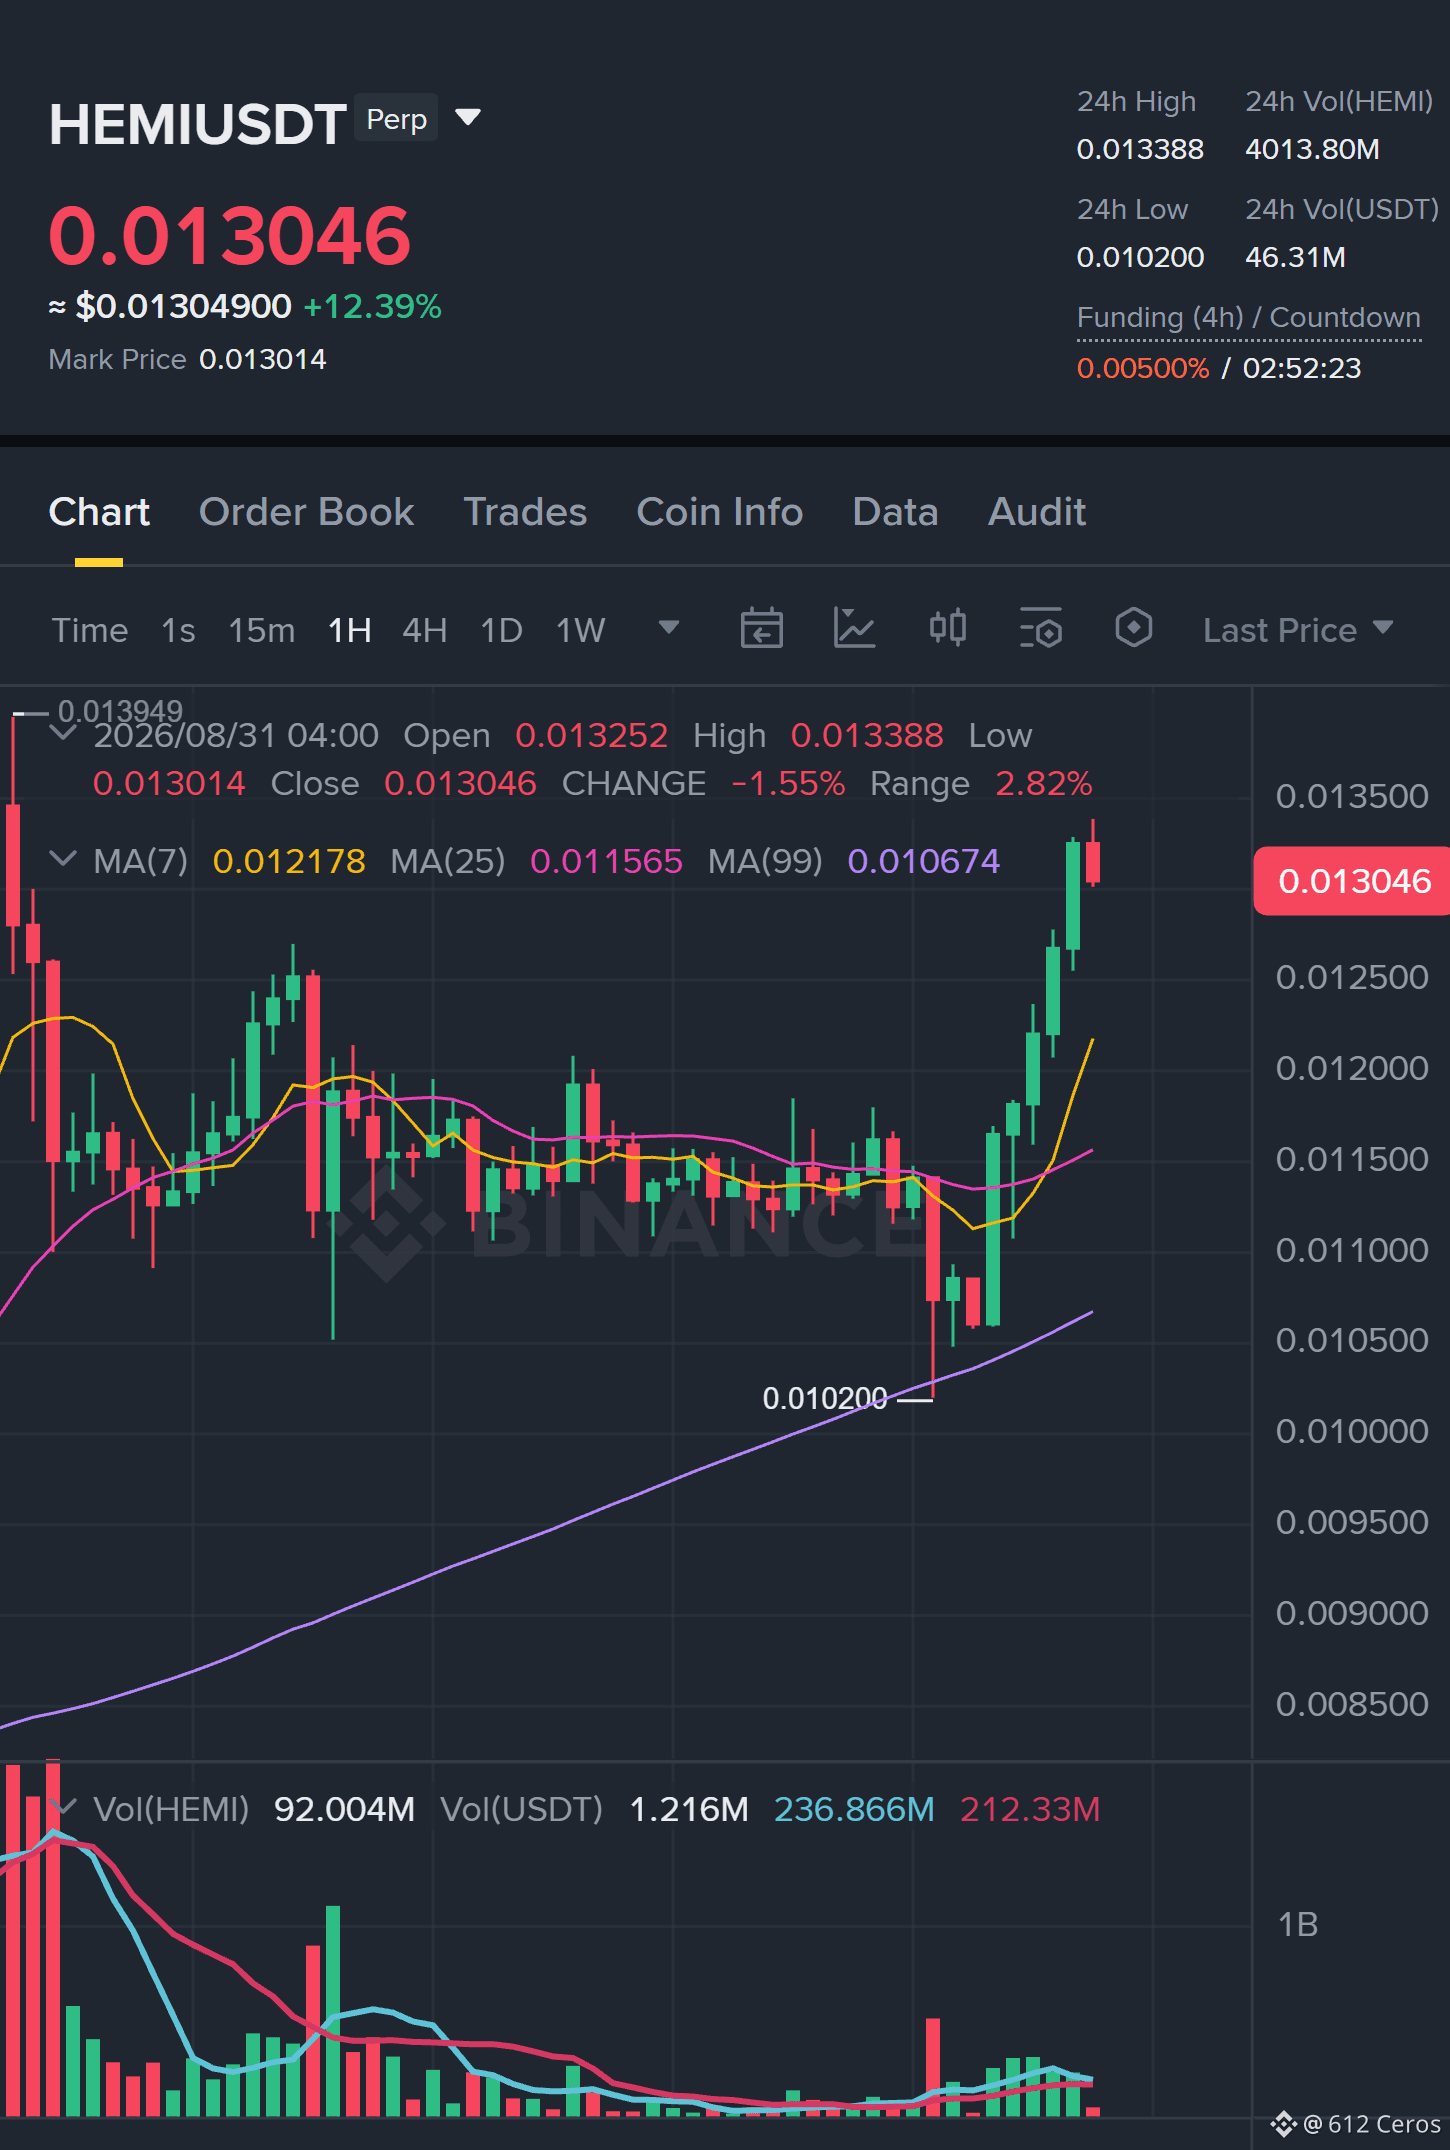
- Price is sitting at 0.0130540, with a tight entry zone from 0.0129748 to 0.0131332.
- The RSI on the 15-minute is already at 78.24, which means momentum is hot, but the trend is pushing through the overbought zone—this is a strength sign, not a reversal signal.
- The target ladder is massive: TP1 at 0.0146025, TP2 at 0.0156348, and TP3 at 0.0171832, offering a risk-to-reward of roughly 1:4 from the entry.
- Stop loss at 0.0109894 keeps the downside contained, and the invalid level at 0.0093335 confirms the structure is holding.
Why now? The 1-day timeframe is in a range, but the 4-hour is breaking out of it. This is the window where ranges turn into trends, and the current price action is the ignition point. The high confidence score (89) suggests the setup has been building, and the lack of confirmation count means we are early, not late.
The momentum is real, but do not chase. Wait for the pullback into the entry zone or a break above the entry ref with volume. This is a trend play, not a scalp.
Debate:
Are you loading up at the entry zone or waiting for a retest of 0.0130 before you trust this breakout?
Click here to view the chart 👇️
⚠️ Personal market analysis only. NFA — manage risk and DYOR.
$HEMI - 🟢 LONG · Conf 89%
Trade Plan:
Entry: 0.0129748 – 0.0131332
SL: 0.0109894
TP1: 0.0146025
TP2: 0.0156348
TP3: 0.0171832
Why this setup?
The 4-hour chart is flashing a trend-following LONG with an 89% confidence score, but the real edge is in the timing.
- Price is sitting at 0.0130540, with a tight entry zone from 0.0129748 to 0.0131332.
- The RSI on the 15-minute is already at 78.24, which means momentum is hot, but the trend is pushing through the overbought zone—this is a strength sign, not a reversal signal.
- The target ladder is massive: TP1 at 0.0146025, TP2 at 0.0156348, and TP3 at 0.0171832, offering a risk-to-reward of roughly 1:4 from the entry.
- Stop loss at 0.0109894 keeps the downside contained, and the invalid level at 0.0093335 confirms the structure is holding.
Why now? The 1-day timeframe is in a range, but the 4-hour is breaking out of it. This is the window where ranges turn into trends, and the current price action is the ignition point. The high confidence score (89) suggests the setup has been building, and the lack of confirmation count means we are early, not late.
The momentum is real, but do not chase. Wait for the pullback into the entry zone or a break above the entry ref with volume. This is a trend play, not a scalp.
Debate:
Are you loading up at the entry zone or waiting for a retest of 0.0130 before you trust this breakout?
Click here to view the chart 👇️
⚠️ Personal market analysis only. NFA — manage risk and DYOR.