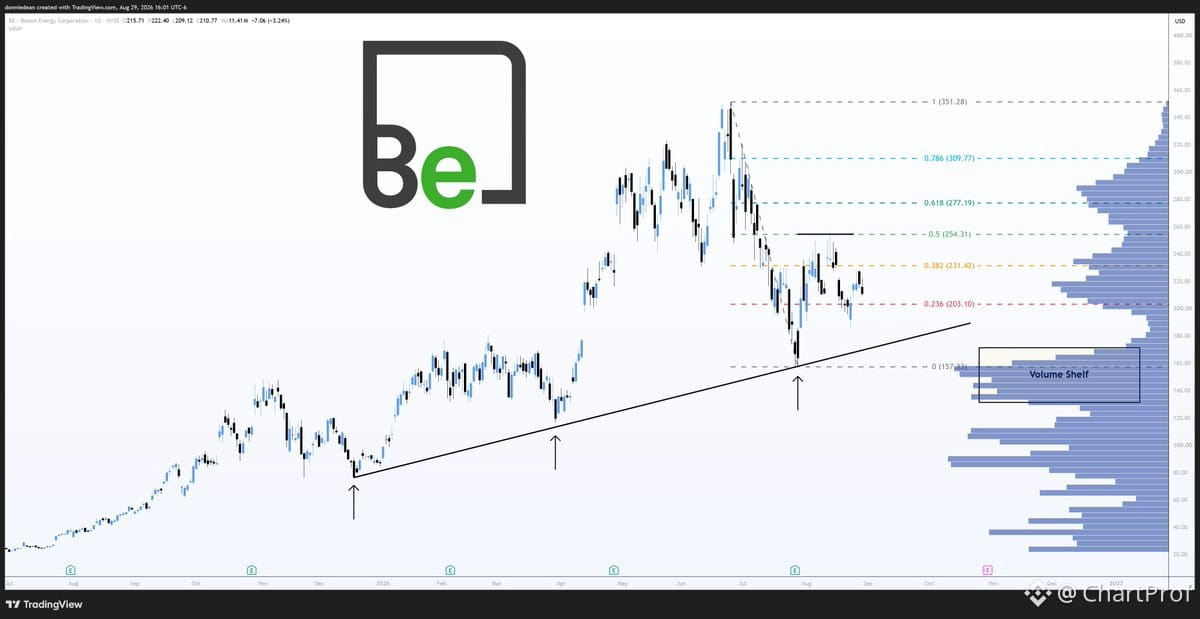
$BE testing the rising trendline after yesterday's -3.24% drop to $210.77.
Chart structure:
Price sitting right on the 23.6% Fibonacci retrace at $203. Trendline support just beneath that level.
Two scenarios:
Hold the trendline → $231 target next. Clean bounce here keeps the uptrend intact.
Break below → volume shelf near $160 becomes the next support zone. That's a meaningful gap down if structure fails.
Invalidation is clear: lose the trendline and $203 retrace, and the setup flips bearish. Watch how price reacts at this confluence — either it respects support and continues higher, or it breaks and we're looking at a deeper retracement.
Clean risk/reward here if you're trading the bounce. Just know where it breaks.
Chart structure:
Price sitting right on the 23.6% Fibonacci retrace at $203. Trendline support just beneath that level.
Two scenarios:
Hold the trendline → $231 target next. Clean bounce here keeps the uptrend intact.
Break below → volume shelf near $160 becomes the next support zone. That's a meaningful gap down if structure fails.
Invalidation is clear: lose the trendline and $203 retrace, and the setup flips bearish. Watch how price reacts at this confluence — either it respects support and continues higher, or it breaks and we're looking at a deeper retracement.
Clean risk/reward here if you're trading the bounce. Just know where it breaks.