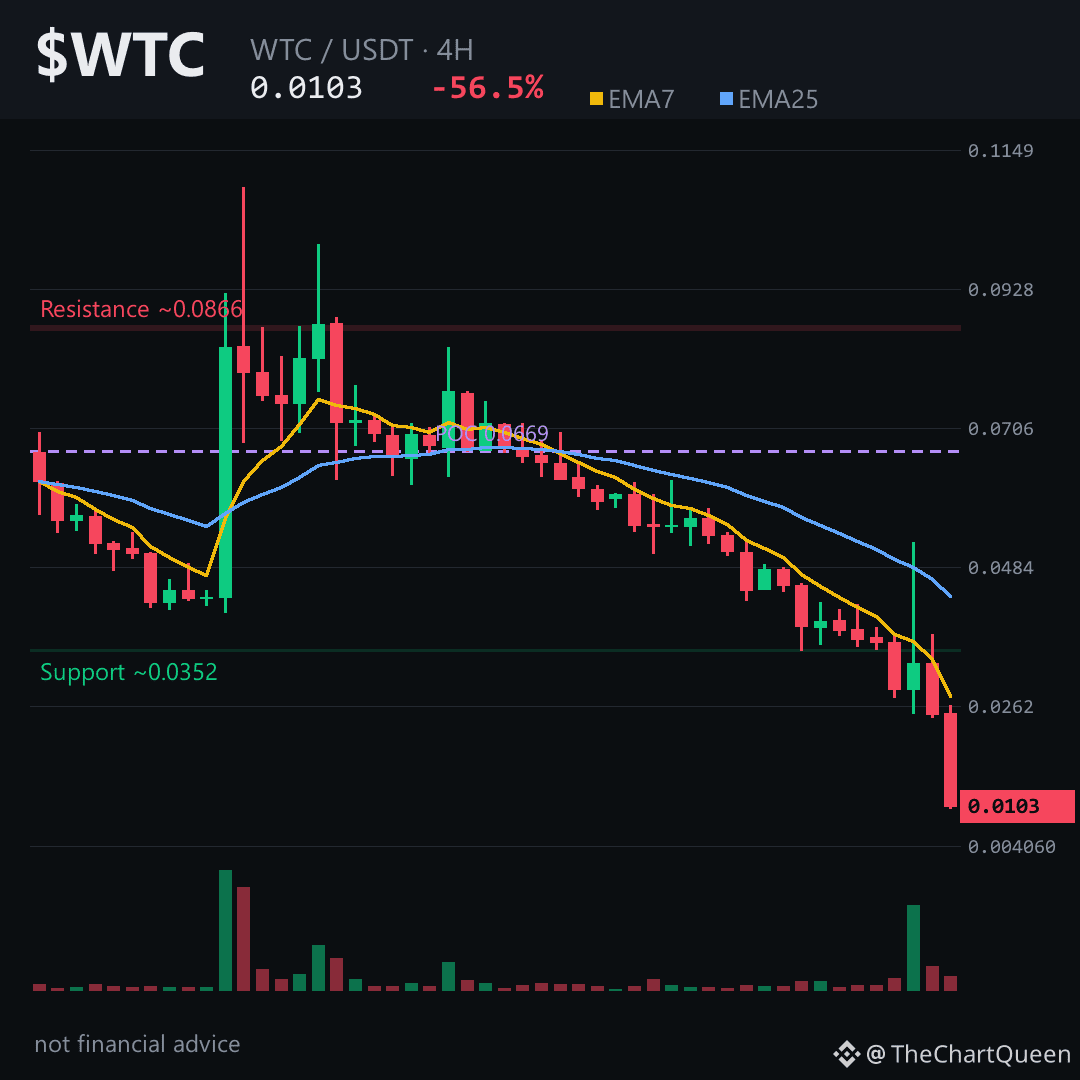
Traders keep pointing to the 56% 24‑hour plunge as the final nail for $WTC, but the real story lives in the 4‑hour micro‑structure. 👇
Price is glued to the lower edge of the 4H volume‑profile while the EMA7 sits well beneath EMA25 – a textbook death‑cross. RSI languishes in the low‑20s and the last 48 hours delivered 9 red candles versus 3 green, confirming relentless selling pressure.
On the 4‑hour chart the current area hovers around the 0.0103 zone. If $WTC can’t defend the ~0.0109 ceiling, the next logical pocket is near 0.0094. Tap $WTC to pull up the chart and see these zones yourself.
My read: the bear’s grip is tightening; a break above 0.0109 would invalidate the bearish premise.
Follow me for the next update when WTC finally tests that 0.0094 floor – you won’t want to miss the shift.
What level are you watching on WTC and why? 👇
⚠️ Not financial advice. DYOR.
#WTC #Crypto #BinanceSquare #TopLoser
Price is glued to the lower edge of the 4H volume‑profile while the EMA7 sits well beneath EMA25 – a textbook death‑cross. RSI languishes in the low‑20s and the last 48 hours delivered 9 red candles versus 3 green, confirming relentless selling pressure.
On the 4‑hour chart the current area hovers around the 0.0103 zone. If $WTC can’t defend the ~0.0109 ceiling, the next logical pocket is near 0.0094. Tap $WTC to pull up the chart and see these zones yourself.
My read: the bear’s grip is tightening; a break above 0.0109 would invalidate the bearish premise.
Follow me for the next update when WTC finally tests that 0.0094 floor – you won’t want to miss the shift.
What level are you watching on WTC and why? 👇
⚠️ Not financial advice. DYOR.
#WTC #Crypto #BinanceSquare #TopLoser