

Ontology Gas put in one of the sharpest moves on the board this week — a slow, patient nine-day grind higher that suddenly erupted into a parabolic spike to $0.20. Since then it's been giving back gains in an orderly fashion, and the current pullback is testing whether the bigger trend still holds.
Market Snapshot
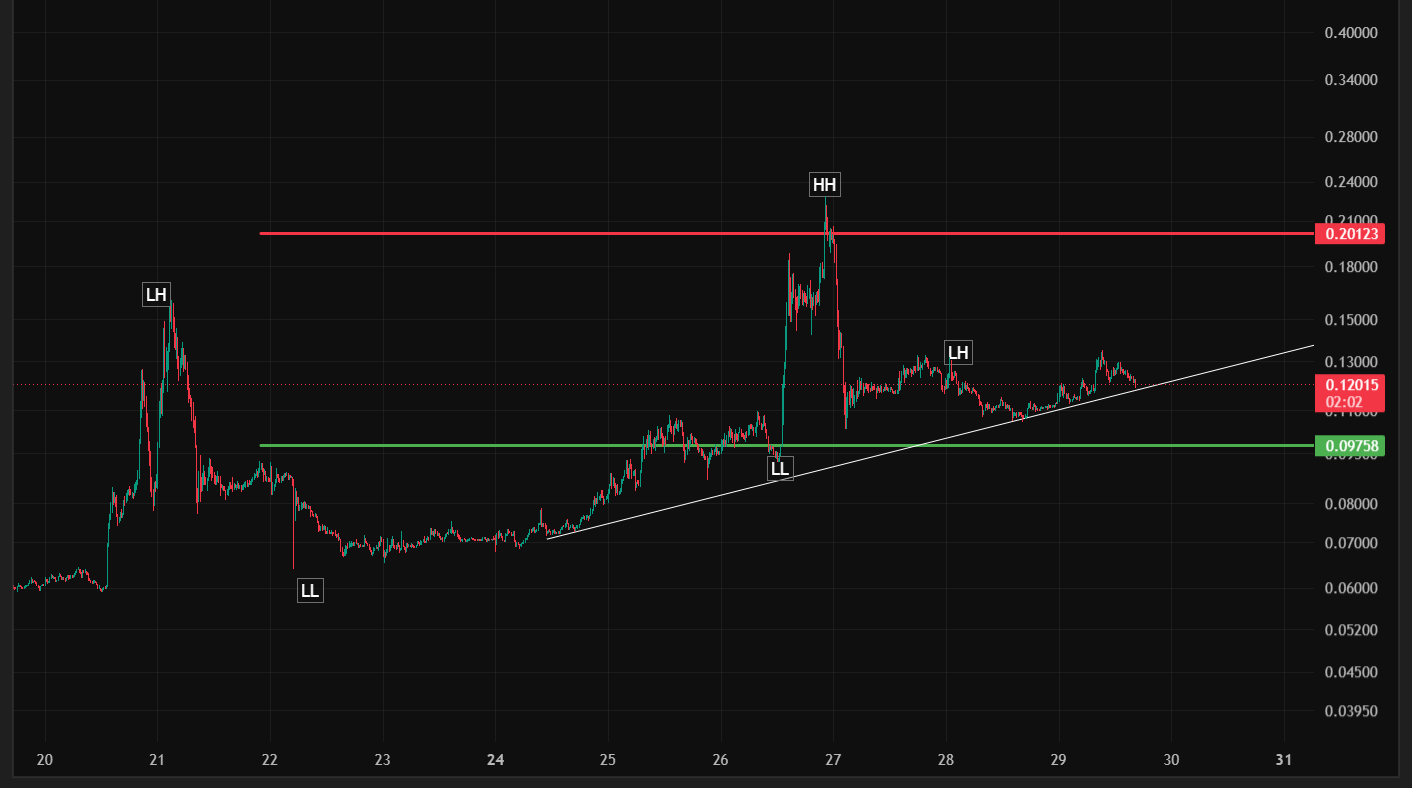
ONG/USDT is trading around $0.12014 on Binance Perpetuals at the time of writing, down 1.56% on the last 15-minute candle (O $0.12203 / H $0.12230 / L $0.11850 / C $0.12014) after tagging an intraday high of $0.20123 earlier in the week. Price is now consolidating well below that spike high, sitting close to the long-term rising trendline that's been in place since Aug 22.
Structure Breakdown
The 15-minute chart shows three distinct phases over the past nine days:
Initial spike and reset (Aug 20–22): ONG spiked hard to a Lower High near $0.155, then crashed back down to a Lower Low near $0.058 — an early, more violent version of the volatility that would repeat later.
The long grind (Aug 22–26): From that low, ONG spent four days quietly climbing along a well-defined rising trendline, building a patient base rather than chasing another spike — a healthier structural foundation than the first move had.
The parabolic breakout (Aug 26–29): That grind exploded into a sharp rally, tearing straight up to a Higher High at $0.20123. Since then, price has been fading in stages — first to a Lower High near $0.13, then grinding sideways to the current $0.12014, still comfortably above the rising trendline and the green support shelf.
Key Levels to Watch
Immediate support: $0.11 (recent consolidation floor)
Structural support (trendline confluence): $0.09758 (green level, aligned with the long-term rising trendline)
Resistance 1: $0.13 (white level, the most recent Lower High)
Resistance 2 (major): $0.20123 (red level, the parabolic spike high)
Trade Setups (Not Financial Advice)
Setup 1 — Trendline Support Bounce (lower risk, higher probability)
Entry zone: $0.098 – $0.113, on a hold of the rising trendline and green support shelf
Stop loss: below $0.093 (a clean break of the trendline and structural support)
Target 1: $0.13
Target 2: $0.16, then $0.20123 on continued strength
Risk-to-reward: roughly 1:2 to 1:3.5 depending on fill location
Setup 2 — Range Breakout (higher risk, for confirmation traders)
Entry trigger: a 15m candle close above $0.132
Stop loss: $0.113 (below the current consolidation low)
Target 1: $0.16
Target 2: $0.20123 if momentum returns with volume
Invalidation: A clean close below $0.093 would break the long-term rising trendline that's supported this entire move since Aug 22 — in that scenario, the setup should be considered invalidated, with the $0.058 low from the original reset as the next area of interest on a deeper unwind.
The Bigger Picture
The most important structural detail here is that the current pullback, however sharp it feels day to day, is still unfolding above the rising trendline that's defined this whole move — that's meaningfully different from the violent, trendline-breaking crash that followed the first spike back on Aug 21–22. As long as ONG holds the $0.098–$0.113 zone, the bigger uptrend remains intact and another attempt at $0.13 and eventually $0.20123 stays on the table. Losing the trendline would be the clearest signal that this parabolic move has fully run its course.
A note on price sourcing: external quotes for ONG were unusually scattered across sources during this check, likely reflecting the coin's high volatility and varying update lag — this analysis relies on the chart's own live price as the primary reference, cross-checked loosely against the closest available live source.
Coins that move this fast can reverse just as quickly, so treat these levels as a framework and always trade with a stop loss.
This article is for informational purposes only and does not constitute financial advice. Cryptocurrency trading carries significant risk of loss. Always do your own research (DYOR) and manage risk according to your own risk tolerance before trading.
@Binance Square Official #AntiQuantumBitcoinTransactionMinedOnMainnet #BitcoinSpotETFEnds9DayInflowStreak #YenPasses160PerDollarToOneMonthLow #Binance #ChartSniper