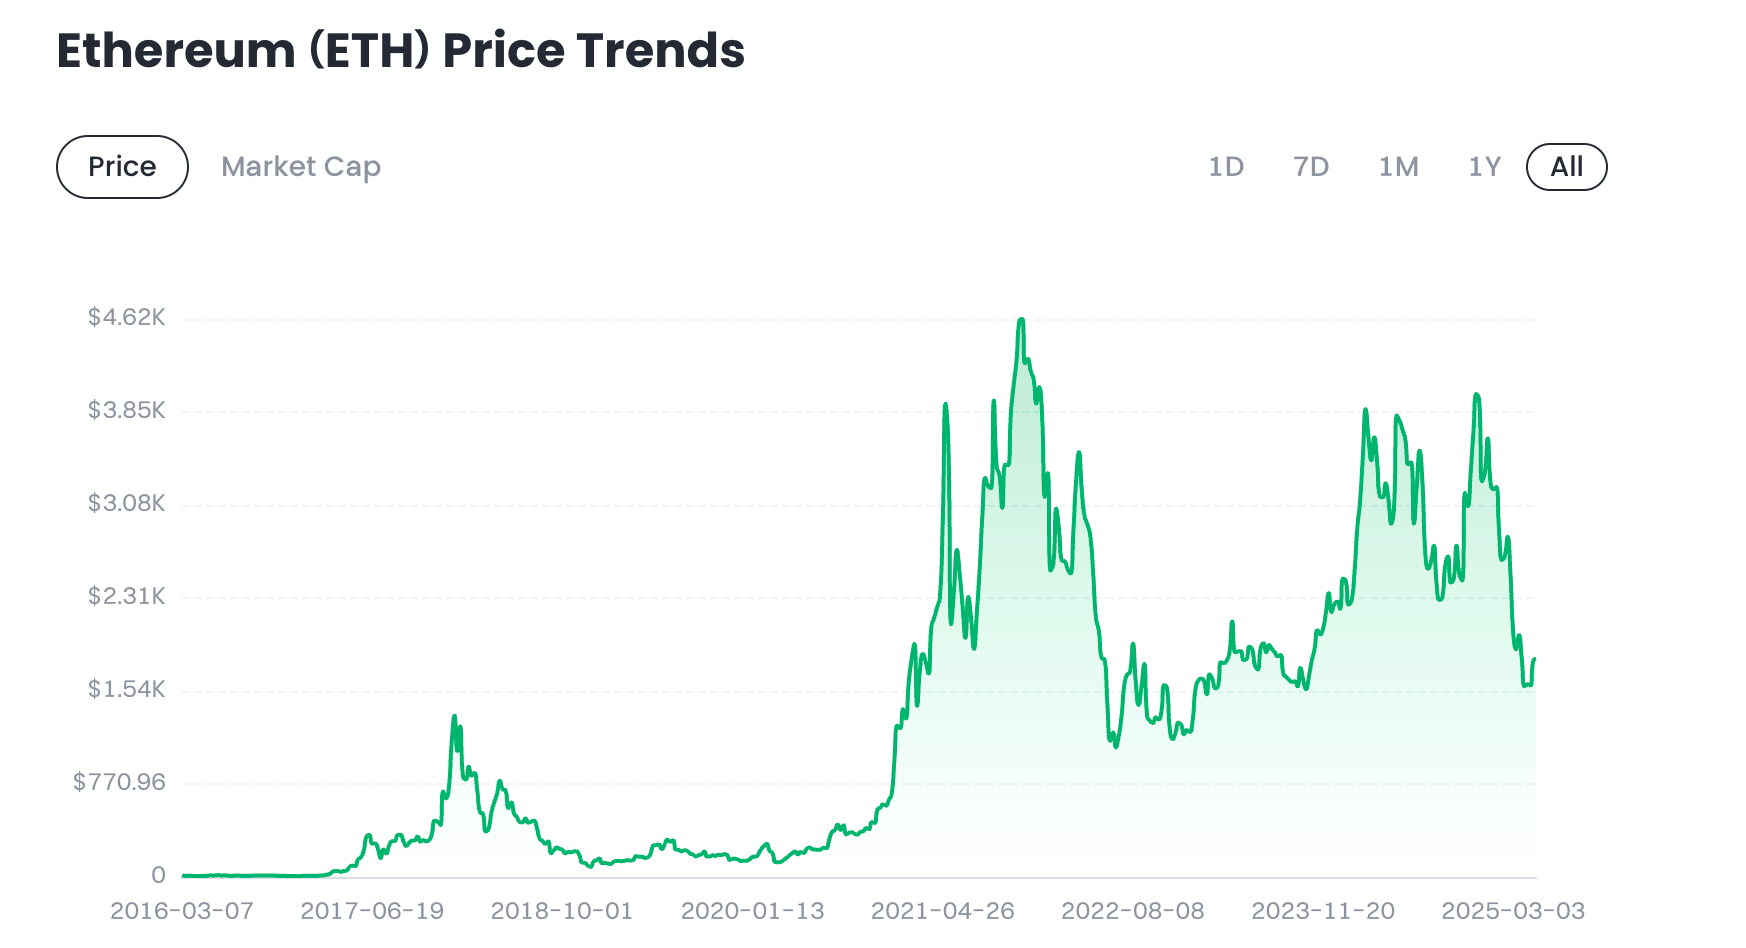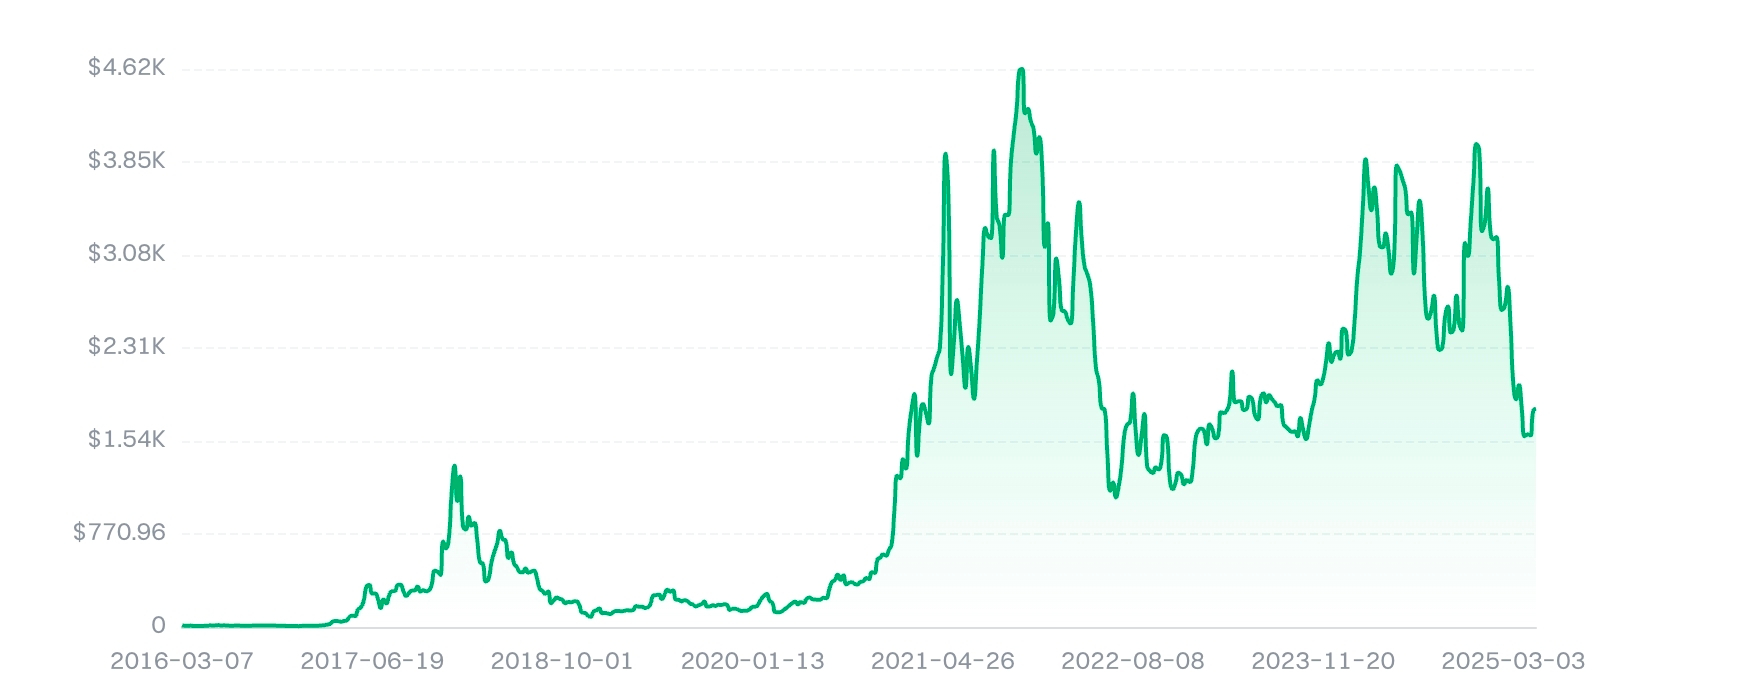

Ethereum (ETH)$ETH is attracting attention after a strong rally from around $1,900 toward $2,550, followed by a recent pullback toward the $2,400 region.
The latest market movement suggests that ETH $ETH is currently experiencing short-term selling pressure and consolidation. Recent bearish candles indicate profit-taking after the previous rally, while the $2,400–$2,420 area has become an important zone for traders to watch.
🕯️ Candle Chart Analysis
The recent candles show that sellers have become more active near higher price levels. However, a correction after a strong rally does not automatically mean the overall trend has turned bearish.
Key levels to watch:
🟢 Support: $2,400–$2,420
🔴 Resistance: $2,480–$2,500
🚀 Major breakout zone: Around $2,535–$2,555
If ETH holds above its support zone and buyers return with strong bullish candles, Ethereum could attempt another move toward the $2,500 area. On the other hand, a decisive break below support could increase the risk of a deeper short-term correction.
📈 The Bigger Picture
Ethereum has also benefited from growing institutional interest and developments around Ethereum investment products and staking. Recent reporting has highlighted continued attention toward Ethereum ETFs and staking-related products, although crypto markets remain highly sensitive to broader economic conditions.
🔥 Final Outlook
For now, ETH appears to be in a critical consolidation phase. The next major move may depend on whether buyers successfully defend the $2,400 support area.

#YenPasses160PerDollarToOneMonthLow #NYSilverFuturesDrop3% #NYSilverFuturesDrop3%