OUSDT: Testing Upper Boundary of Rectangular Channel – Tactical Counter-Trend Short Setup with Strict Risk Allocation
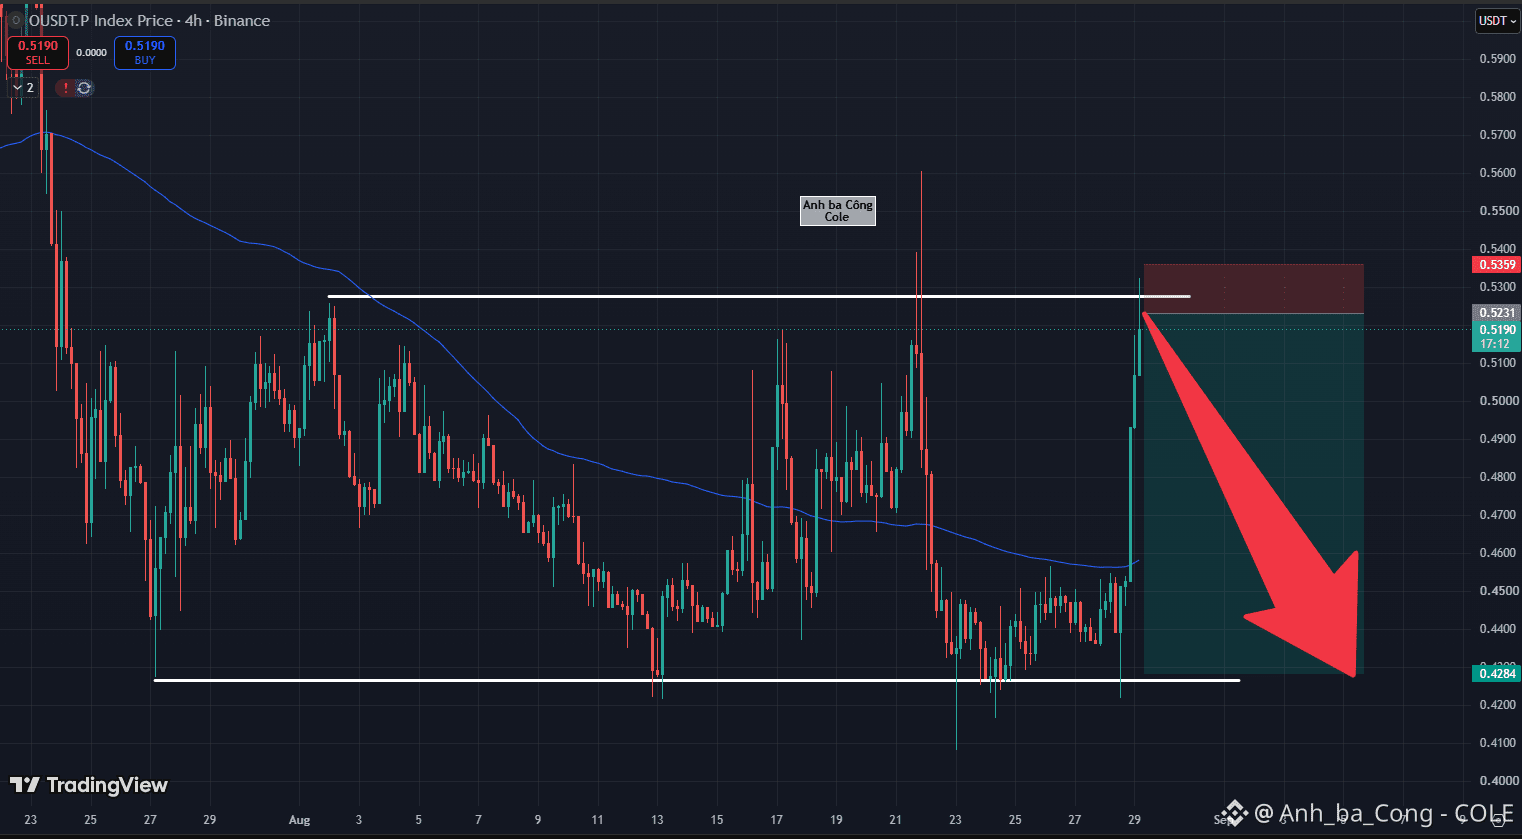
OUSDT is flashing a clear technical rejection signal on the 4-hour timeframe as price action completes an aggressive vertical surge into the upper resistance boundary of a rectangular consolidation pattern. The multi-week market structure remains defined by a well-established horizontal range bounded cleanly between two parallel levels.
Based on the visual data from the 4-hour chart , the recent upward wave pushed price candles cleanly above the dynamic MA100 trendline into the $0.5230 resistance ceiling. However, upon testing this structural boundary, upward momentum abruptly decelerated under immediate overhead supply. In accordance with textbook range-bound mechanics, buyer exhaustion at the ceiling provides a solid technical premise for a mean-reversion drop back toward the support floor.
This technical framework offers a high-edge Short execution opportunity featuring superior risk-to-reward metrics. The optimal strategy is to initiate Short positions around the $0.5190–$0.5230 resistance zone, establishing a tight protective stop-loss parameter directly above $0.5360. Because broader market sentiment remains generally positive, disciplined risk management requires entering this counter-trend setup with reduced capital sizing. The strategic take-profit target aims directly for the lower range baseline near $0.4280.
Disclaimer: This is not financial advice, DYOR. $O $NIL $AKE
OUSDT is flashing a clear technical rejection signal on the 4-hour timeframe as price action completes an aggressive vertical surge into the upper resistance boundary of a rectangular consolidation pattern. The multi-week market structure remains defined by a well-established horizontal range bounded cleanly between two parallel levels.
Based on the visual data from the 4-hour chart , the recent upward wave pushed price candles cleanly above the dynamic MA100 trendline into the $0.5230 resistance ceiling. However, upon testing this structural boundary, upward momentum abruptly decelerated under immediate overhead supply. In accordance with textbook range-bound mechanics, buyer exhaustion at the ceiling provides a solid technical premise for a mean-reversion drop back toward the support floor.
This technical framework offers a high-edge Short execution opportunity featuring superior risk-to-reward metrics. The optimal strategy is to initiate Short positions around the $0.5190–$0.5230 resistance zone, establishing a tight protective stop-loss parameter directly above $0.5360. Because broader market sentiment remains generally positive, disciplined risk management requires entering this counter-trend setup with reduced capital sizing. The strategic take-profit target aims directly for the lower range baseline near $0.4280.
Disclaimer: This is not financial advice, DYOR. $O $NIL $AKE