#BTC
Bitcoin Prints "Shooting Star" — Can Bulls Hold $77K?
Bitcoin just delivered a major weekly signal, and traders are watching closely.
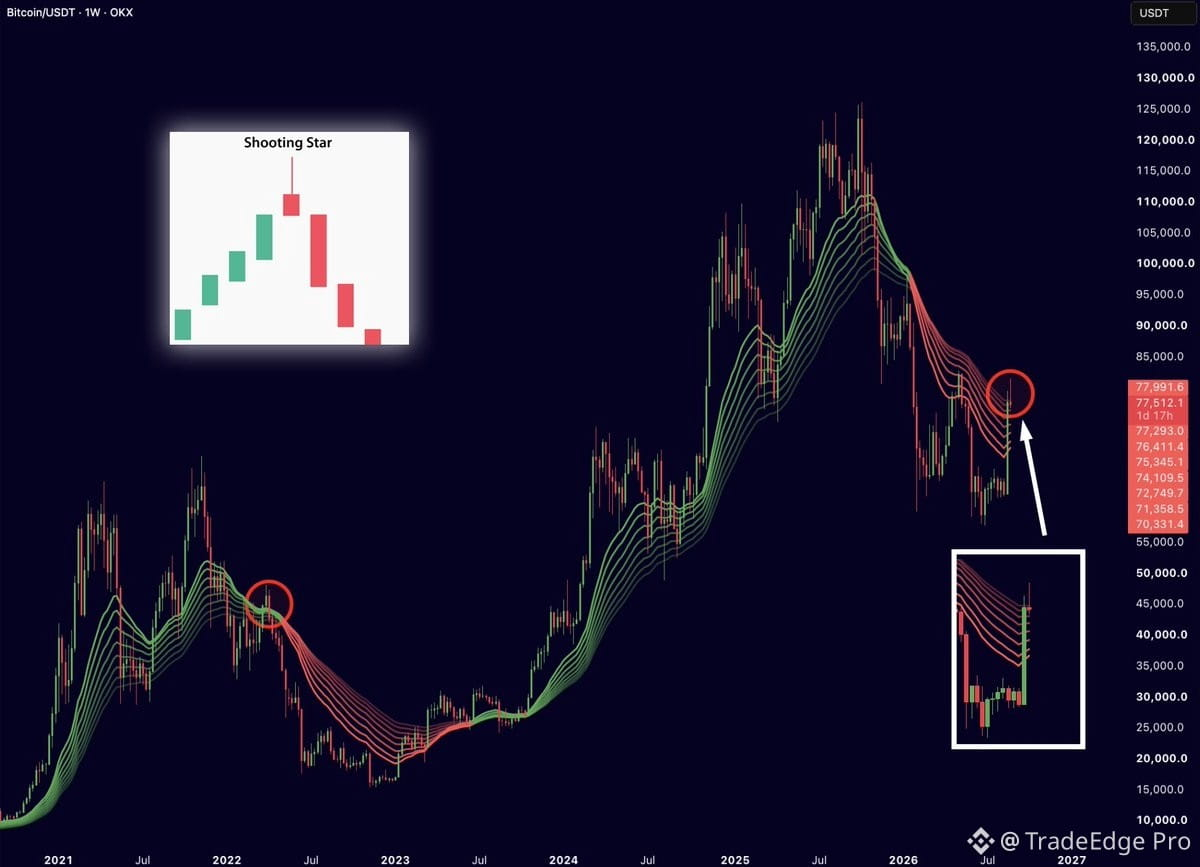
On the BTC/USDT 1W chart on OKX, Bitcoin rallied to test the descending EMAs near $78K, only to get rejected and print what looks like a "Shooting Star" candle.
Key levels to watch:
Current: $77,991.6
Rejection zone: $77,512 - $78,000. The red EMAs are acting as resistance
Support zone: $70,331 - $72,749. Where the recent bounce started
What the chart is saying:
Shooting Star pattern: The inset shows it clearly — big wick up, small body down. This is a classic sign of rejection after a rally.
EMA confluence: Bitcoin tried to flip the red descending EMAs to support, just like it did in early 2022 before the big drop. History doesn't repeat, but it rhymes.
The bullish case: The zoomed inset shows strong buying pressure. Despite the wick, BTC still closed the week green and held above $70K.
The last time we saw this setup was in 2022. Back then, the rejection led to a deeper correction. This time, the macro is different — ETFs, institutions, and halving cycle.
For now, $77.5K is the line in the sand. A weekly close above the EMAs opens the door to $85K+. A rejection and loss of $70K support could mean another retest lower.
Volatility is back. Next week’s candle will decide everything.
Bitcoin Prints "Shooting Star" — Can Bulls Hold $77K?
Bitcoin just delivered a major weekly signal, and traders are watching closely.
On the BTC/USDT 1W chart on OKX, Bitcoin rallied to test the descending EMAs near $78K, only to get rejected and print what looks like a "Shooting Star" candle.
Key levels to watch:
Current: $77,991.6
Rejection zone: $77,512 - $78,000. The red EMAs are acting as resistance
Support zone: $70,331 - $72,749. Where the recent bounce started
What the chart is saying:
Shooting Star pattern: The inset shows it clearly — big wick up, small body down. This is a classic sign of rejection after a rally.
EMA confluence: Bitcoin tried to flip the red descending EMAs to support, just like it did in early 2022 before the big drop. History doesn't repeat, but it rhymes.
The bullish case: The zoomed inset shows strong buying pressure. Despite the wick, BTC still closed the week green and held above $70K.
The last time we saw this setup was in 2022. Back then, the rejection led to a deeper correction. This time, the macro is different — ETFs, institutions, and halving cycle.
For now, $77.5K is the line in the sand. A weekly close above the EMAs opens the door to $85K+. A rejection and loss of $70K support could mean another retest lower.
Volatility is back. Next week’s candle will decide everything.