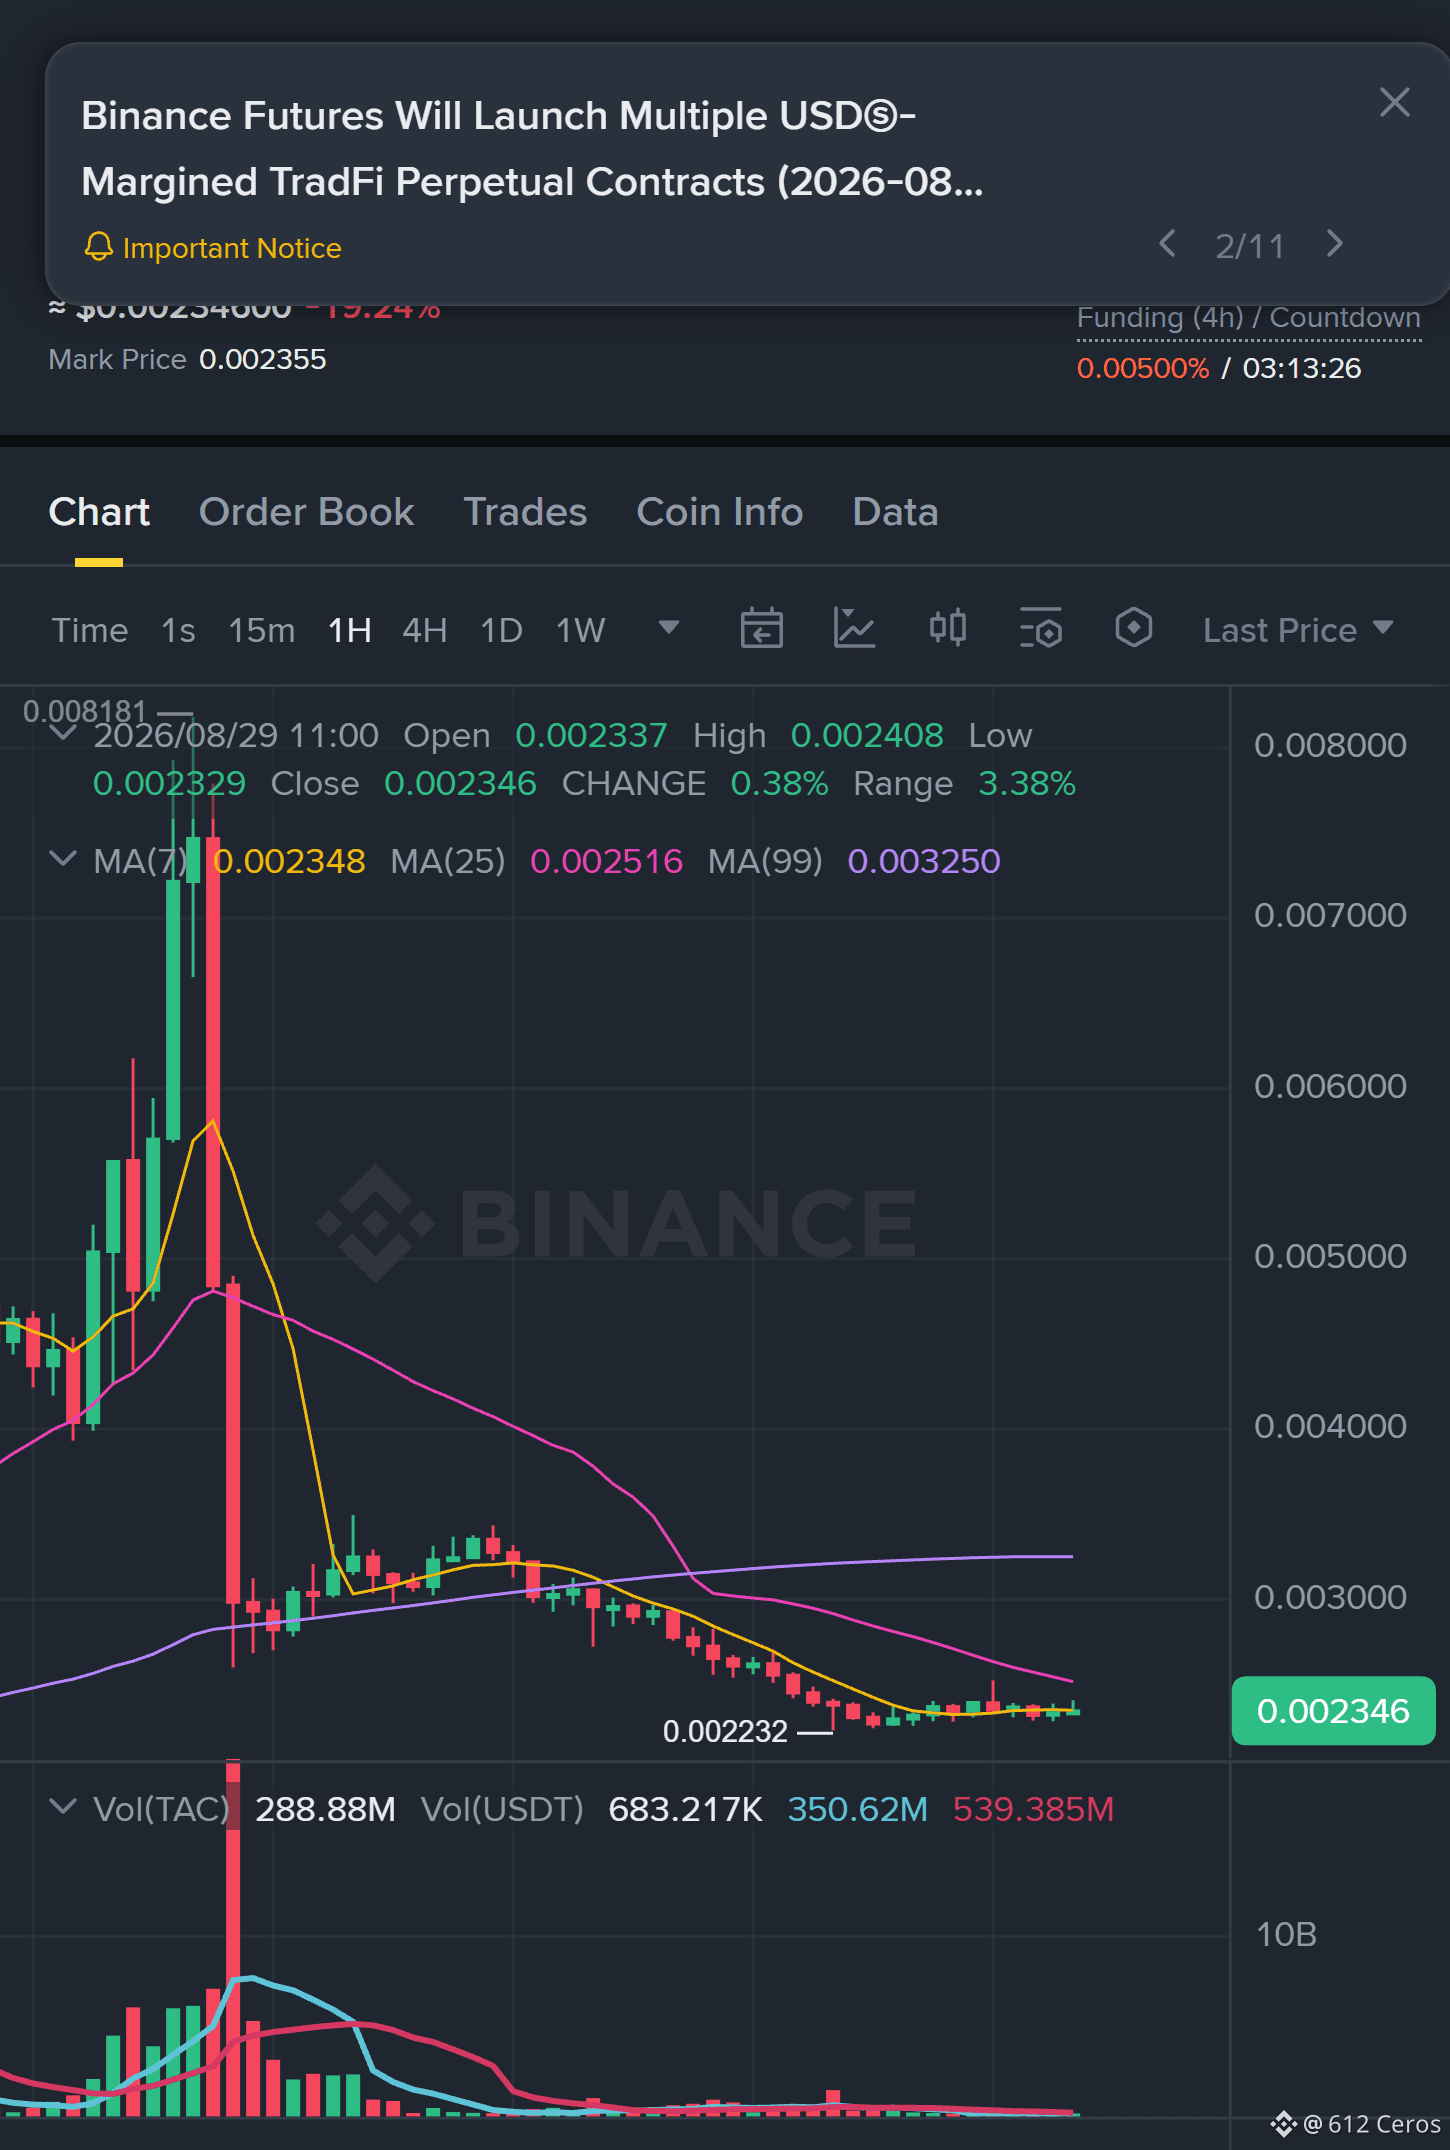
Everyone is staring at the 1-hour bounce, but the daily chart just whispered a secret about $TAC /USDT.
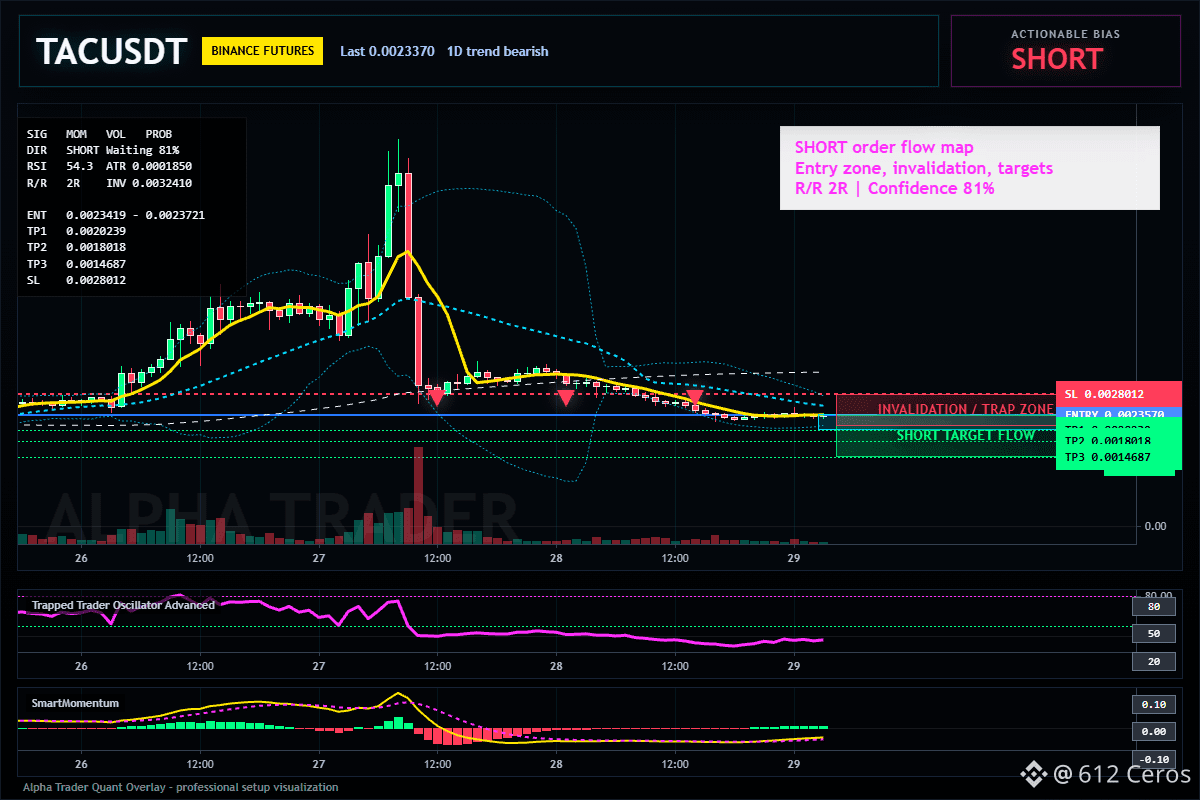
$TAC - 🟢 SHORT · Conf 81%
Trade Plan:
Entry: 0.0023419 – 0.0023721
SL: 0.0028012
TP1: 0.0020239
TP2: 0.0018018
TP3: 0.0014687
Why this setup?
The 15-minute RSI at 54.31 is a classic bull trap inside a larger bearish structure. The 1D trend is still bearish, and my model shows a SHORT bias with 81% confidence. The 4-hour timeframe is aligned with the daily, which means this is a trend-following setup, not a guess. Why now? Because the current price of 0.0023570 is sitting right at the entry reference while the ATR (0.000185) suggests volatility is compressing—a squeeze is coming. The downside targets are clear: TP1 at 0.0020239 and TP2 at 0.0018018. The only thing standing between you and those targets is the noise of this counter-trend bounce. Do not confuse the 15-minute pop with a reversal; the higher timeframe is still in control. If you are waiting for a lower entry, you might miss the move entirely, but if you chase this dead-cat bounce, you are fighting the 1D bearish flow. The math favors the short side, and the stop loss at 0.0028012 gives you a clean invalidation level.
Debate:
Is this 15-minute RSI pop the last exit for longs, or are we about to see a fake breakdown below 0.0020 first?
Click here to view the chart 👇️
⚠️ Personal market analysis only. NFA — manage risk and DYOR.
$TAC - 🟢 SHORT · Conf 81%
Trade Plan:
Entry: 0.0023419 – 0.0023721
SL: 0.0028012
TP1: 0.0020239
TP2: 0.0018018
TP3: 0.0014687
Why this setup?
The 15-minute RSI at 54.31 is a classic bull trap inside a larger bearish structure. The 1D trend is still bearish, and my model shows a SHORT bias with 81% confidence. The 4-hour timeframe is aligned with the daily, which means this is a trend-following setup, not a guess. Why now? Because the current price of 0.0023570 is sitting right at the entry reference while the ATR (0.000185) suggests volatility is compressing—a squeeze is coming. The downside targets are clear: TP1 at 0.0020239 and TP2 at 0.0018018. The only thing standing between you and those targets is the noise of this counter-trend bounce. Do not confuse the 15-minute pop with a reversal; the higher timeframe is still in control. If you are waiting for a lower entry, you might miss the move entirely, but if you chase this dead-cat bounce, you are fighting the 1D bearish flow. The math favors the short side, and the stop loss at 0.0028012 gives you a clean invalidation level.
Debate:
Is this 15-minute RSI pop the last exit for longs, or are we about to see a fake breakdown below 0.0020 first?
Click here to view the chart 👇️
⚠️ Personal market analysis only. NFA — manage risk and DYOR.