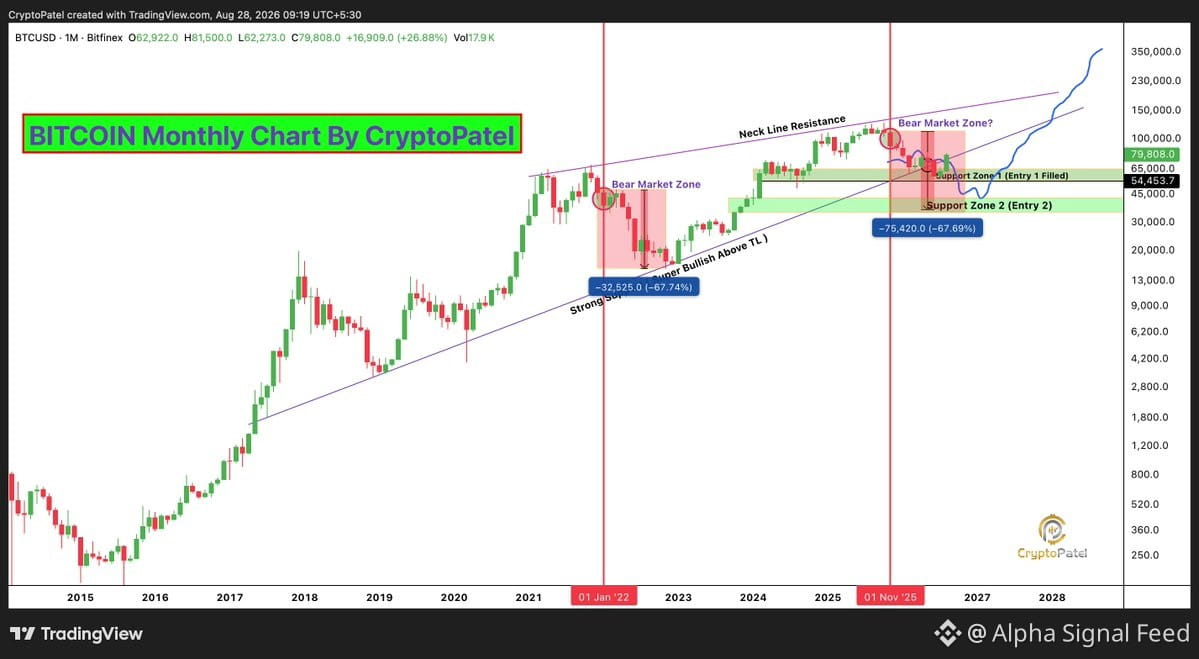
$BTC monthly chart screaming déjà vu
Last bear: -68% drawdown → ripped to new ATH
This cycle: -67% drawdown → already +41% off lows
The structure is literally copy-paste
Break neckline = $150K-$200K in play
Lose support zone 1 = $55K-$45K becomes your entry 2
Same cycle mechanics. Same liquidity pattern. History doesn't repeat but it sure as hell rhymes.
Bookmark this chart.
Last bear: -68% drawdown → ripped to new ATH
This cycle: -67% drawdown → already +41% off lows
The structure is literally copy-paste
Break neckline = $150K-$200K in play
Lose support zone 1 = $55K-$45K becomes your entry 2
Same cycle mechanics. Same liquidity pattern. History doesn't repeat but it sure as hell rhymes.
Bookmark this chart.