🚀 TRUMP RSI + Trade Setup
Current price: ~$2.73
📅 1D RSI
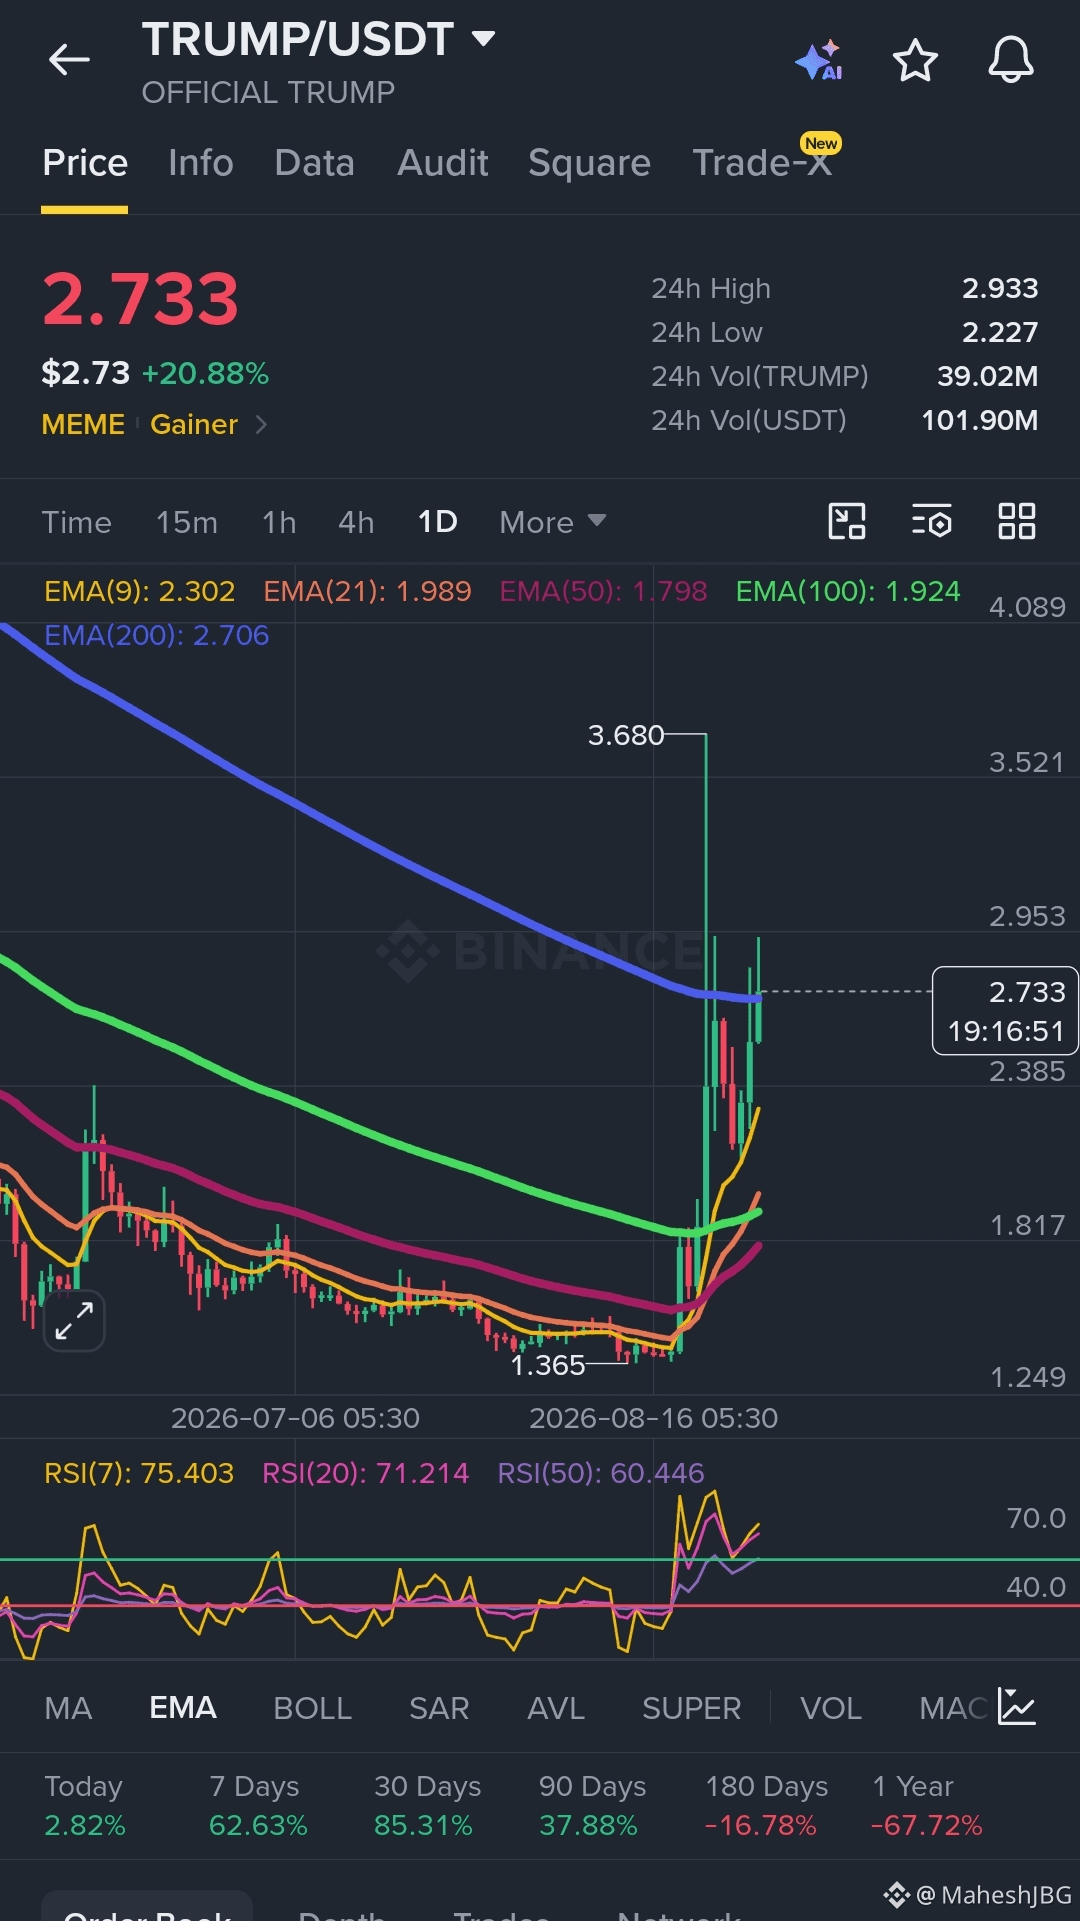
RSI(7): 75.4 🔥 — strongly overbought
RSI(20): 71.2 — overbought
RSI(50): 60.4 — bullish
Price is above the major daily EMAs, including EMA200 ~$2.706.
📆 1W RSI
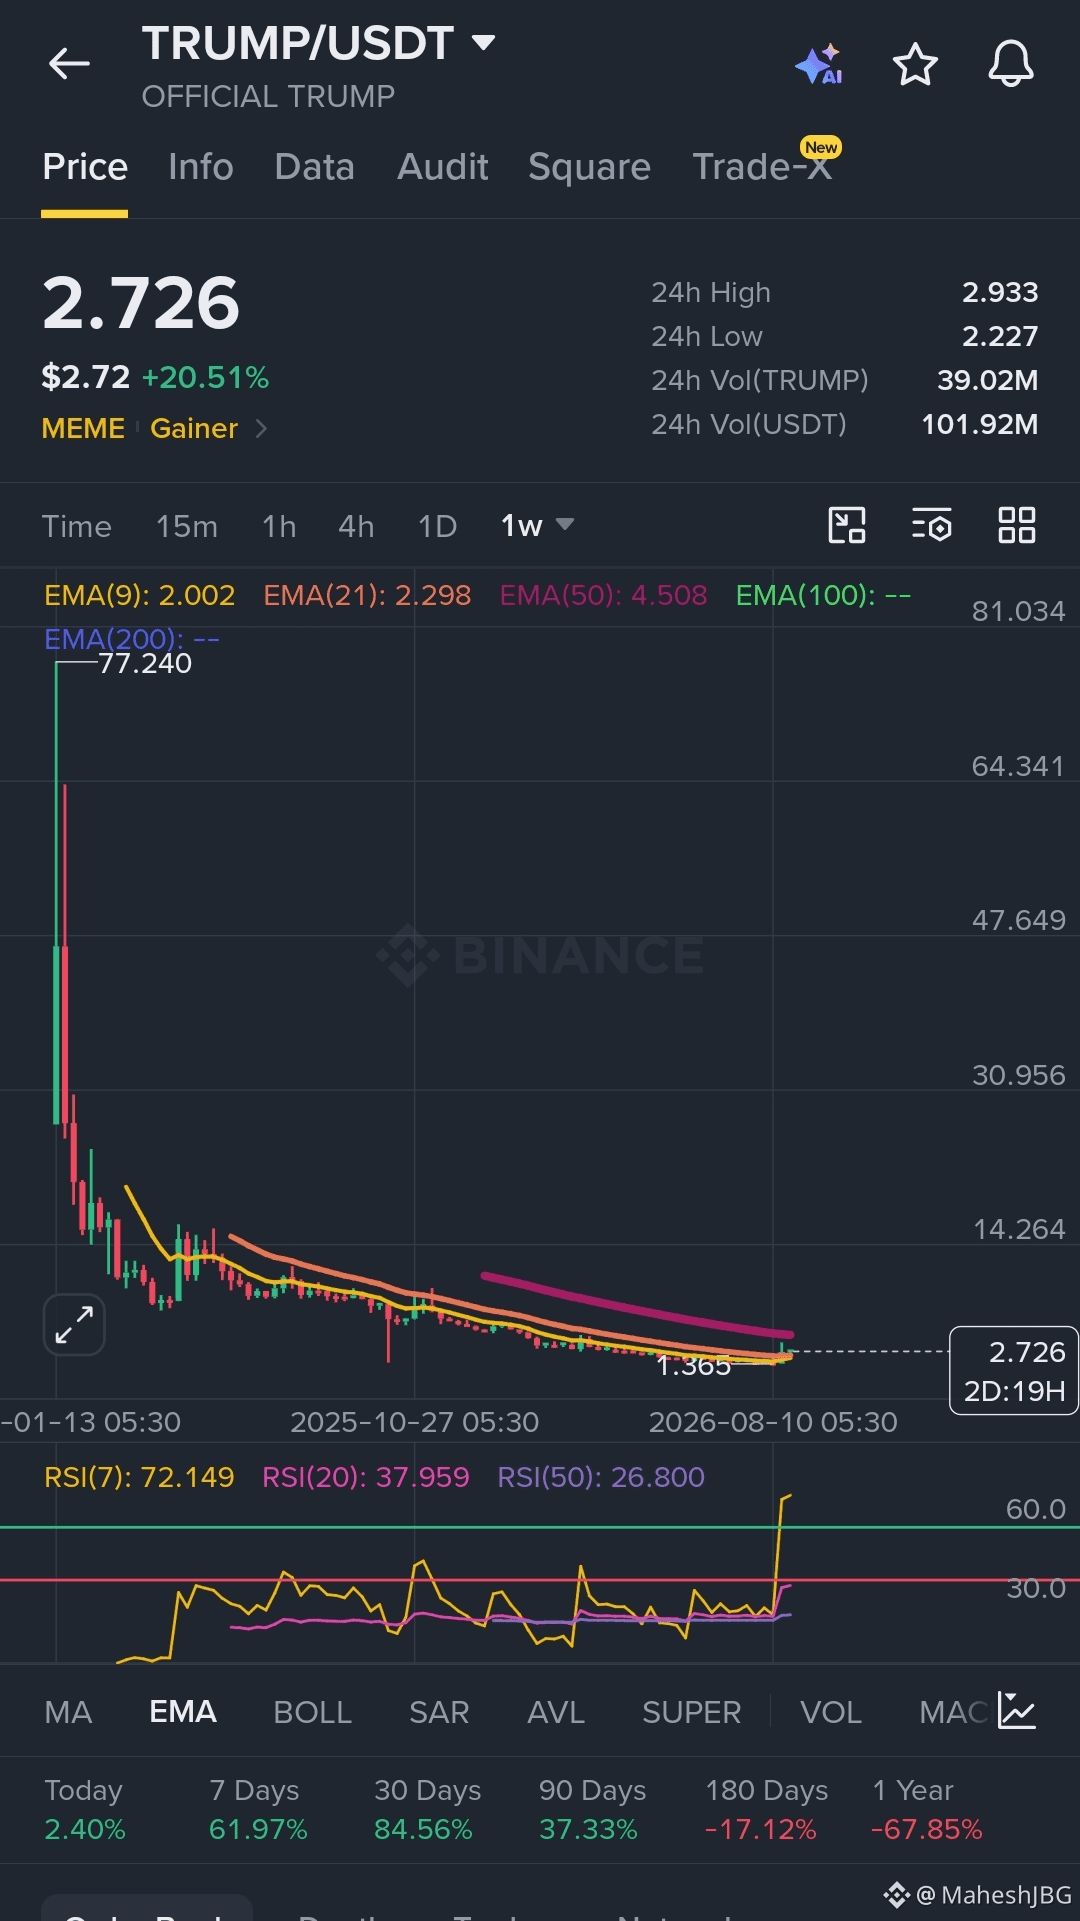
RSI(7): 72.1 🔥 — short-term overbought
RSI(20): 38.0 — still relatively weak
RSI(50): 26.8 — long-term momentum remains weak
Weekly structure is improving sharply after the recent breakout.
🎯 Key Levels
Bullish scenario:
If TRUMP holds $2.70–$2.73, upside continuation could target:
🎯 $2.93
🎯 $3.20
🎯 $3.68
Pullback scenario:
Because both daily and weekly short-term RSI are overbought, a correction is possible:
🟡 Support: $2.70
🟢 Stronger support: $2.38–$2.30
🔴 Below $2.30 would weaken the bullish setup considerably.
📌 Trade Bias
🟢 Bullish, but overheated.
I would not chase a large green candle at $2.73. A pullback/retest around $2.70–$2.55 that holds could provide a better risk/reward long entry.
Upside > downside while $2.70 holds, but losing $2.70 could trigger profit-taking toward $2.38–$2.30.
Technical analysis only, not financial advice. Use risk management.
Current price: ~$2.73
📅 1D RSI
RSI(7): 75.4 🔥 — strongly overbought
RSI(20): 71.2 — overbought
RSI(50): 60.4 — bullish
Price is above the major daily EMAs, including EMA200 ~$2.706.
📆 1W RSI
RSI(7): 72.1 🔥 — short-term overbought
RSI(20): 38.0 — still relatively weak
RSI(50): 26.8 — long-term momentum remains weak
Weekly structure is improving sharply after the recent breakout.
🎯 Key Levels
Bullish scenario:
If TRUMP holds $2.70–$2.73, upside continuation could target:
🎯 $2.93
🎯 $3.20
🎯 $3.68
Pullback scenario:
Because both daily and weekly short-term RSI are overbought, a correction is possible:
🟡 Support: $2.70
🟢 Stronger support: $2.38–$2.30
🔴 Below $2.30 would weaken the bullish setup considerably.
📌 Trade Bias
🟢 Bullish, but overheated.
I would not chase a large green candle at $2.73. A pullback/retest around $2.70–$2.55 that holds could provide a better risk/reward long entry.
Upside > downside while $2.70 holds, but losing $2.70 could trigger profit-taking toward $2.38–$2.30.
Technical analysis only, not financial advice. Use risk management.