SOLANA (SOL) — A Key Historical Support Area? 📊
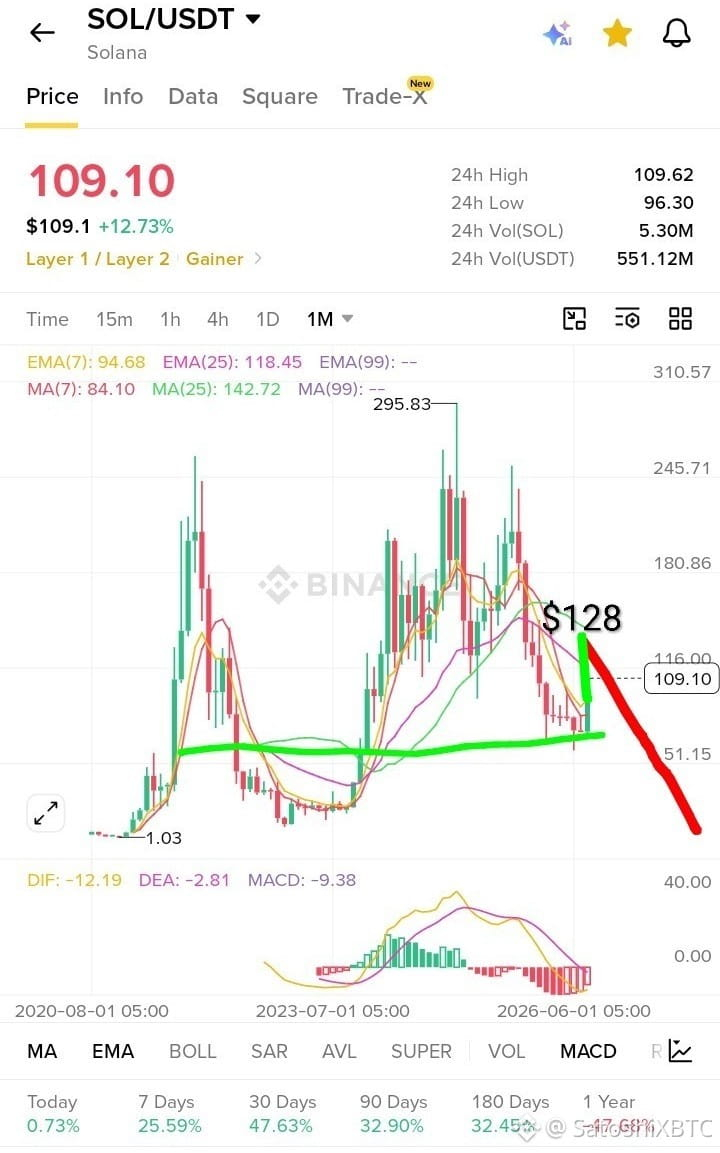
Looking at the monthly chart, SOL appears to be testing a long-term support area that has played an important role in previous market cycles.
The green line highlights a zone where price previously found support and later started strong upside moves. Interestingly, SOL is now approaching the same broader area again.
If this support holds and SOL gets a strong monthly confirmation, the first important levels to watch could be:
🎯 $116
🎯 $128
🎯 $150
🎯 $180+
However, if SOL loses this support decisively on the monthly timeframe, the bullish setup could weaken and further downside may follow.
The key question is simple:
Will history repeat, or will SOL finally break below this long-term support? 👀
$SOL
$BNB
#OktaCrowdStrikeSurgeOnEarningsBeat #ChinaOpposesUSProposed7.5%Tariff #KospiClosesAtRecordHigh
Looking at the monthly chart, SOL appears to be testing a long-term support area that has played an important role in previous market cycles.
The green line highlights a zone where price previously found support and later started strong upside moves. Interestingly, SOL is now approaching the same broader area again.
If this support holds and SOL gets a strong monthly confirmation, the first important levels to watch could be:
🎯 $116
🎯 $128
🎯 $150
🎯 $180+
However, if SOL loses this support decisively on the monthly timeframe, the bullish setup could weaken and further downside may follow.
The key question is simple:
Will history repeat, or will SOL finally break below this long-term support? 👀
$SOL
$BNB
#OktaCrowdStrikeSurgeOnEarningsBeat #ChinaOpposesUSProposed7.5%Tariff #KospiClosesAtRecordHigh