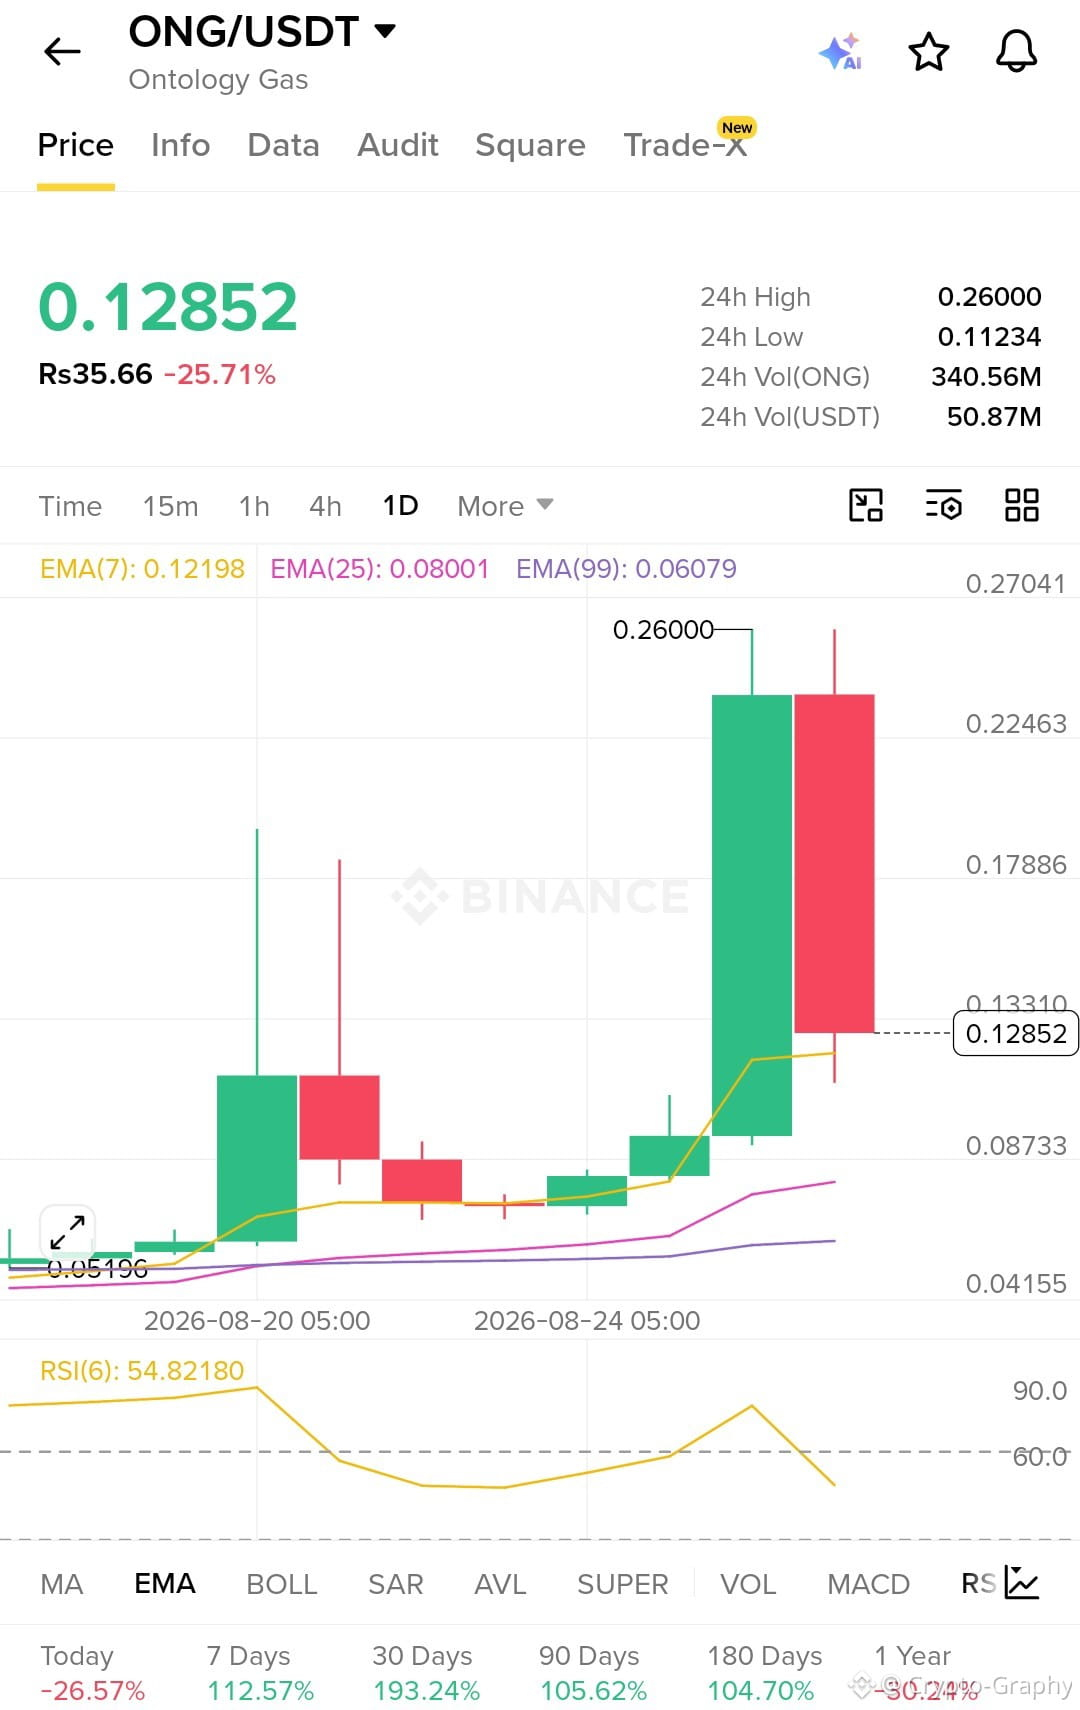
$ONG /USDT Technical Analysis
Current Price: $0.12852
24H Change: -25.71%
24H High: $0.2600
24H Low: $0.11234
Overall Trend: Bullish but Under Strong Correction
ONG has made a very strong rally from around $0.052 to $0.260 in recent days. It has now retraced approximately 50% from the recent high.
The positive point is that the price is still above:
EMA 7: $0.12198
EMA 25: $0.08001
EMA 99: $0.06079
So, the 1D trend is not completely bearish yet.
Important Support Levels
$0.120–$0.122 → First and important short-term support
$0.112–$0.113 → Strong support; 24H low is $0.11234
$0.087–$0.080 → Major support zone / EMA25 area
$0.060–$0.061 → Stronger long-term support / EMA99
Resistance & Targets
$0.133 → Immediate resistance
$0.178–$0.180 → First major upside target
$0.224–$0.225 → Strong resistance
$0.260 → Recent high / major breakout level
RSI
RSI(6): 54.82
RSI previously moved close to the overbought zone but has now cooled down to 54.8. This means the market has cooled significantly, while RSI remains in a neutral-to-bullish zone.
My View
If $0.120–$0.122 holds:
➡️ $0.133 → $0.178 → $0.224 could become the recovery targets.
If $0.112 breaks:
⚠️ The correction could extend toward the $0.087–$0.080 support zone.
If $0.133 is decisively reclaimed:
🔥 Bullish momentum could become strong again, with $0.178 as the next major target.
If $0.260 breaks with a strong daily close:
🚀 It could signal a strong bullish continuation toward new highs.
Bottom line: ONG currently looks like a “bullish trend + heavy profit-taking correction.” The most important level is around $0.12. Holding above this level keeps the bullish setup intact, while a break below $0.112 would significantly increase downside risk.
#BinanceSquareTalks #ONG/USDT
Current Price: $0.12852
24H Change: -25.71%
24H High: $0.2600
24H Low: $0.11234
Overall Trend: Bullish but Under Strong Correction
ONG has made a very strong rally from around $0.052 to $0.260 in recent days. It has now retraced approximately 50% from the recent high.
The positive point is that the price is still above:
EMA 7: $0.12198
EMA 25: $0.08001
EMA 99: $0.06079
So, the 1D trend is not completely bearish yet.
Important Support Levels
$0.120–$0.122 → First and important short-term support
$0.112–$0.113 → Strong support; 24H low is $0.11234
$0.087–$0.080 → Major support zone / EMA25 area
$0.060–$0.061 → Stronger long-term support / EMA99
Resistance & Targets
$0.133 → Immediate resistance
$0.178–$0.180 → First major upside target
$0.224–$0.225 → Strong resistance
$0.260 → Recent high / major breakout level
RSI
RSI(6): 54.82
RSI previously moved close to the overbought zone but has now cooled down to 54.8. This means the market has cooled significantly, while RSI remains in a neutral-to-bullish zone.
My View
If $0.120–$0.122 holds:
➡️ $0.133 → $0.178 → $0.224 could become the recovery targets.
If $0.112 breaks:
⚠️ The correction could extend toward the $0.087–$0.080 support zone.
If $0.133 is decisively reclaimed:
🔥 Bullish momentum could become strong again, with $0.178 as the next major target.
If $0.260 breaks with a strong daily close:
🚀 It could signal a strong bullish continuation toward new highs.
Bottom line: ONG currently looks like a “bullish trend + heavy profit-taking correction.” The most important level is around $0.12. Holding above this level keeps the bullish setup intact, while a break below $0.112 would significantly increase downside risk.
#BinanceSquareTalks #ONG/USDT