What if the 4h chart says LONG but the daily range is screaming at you to wait?
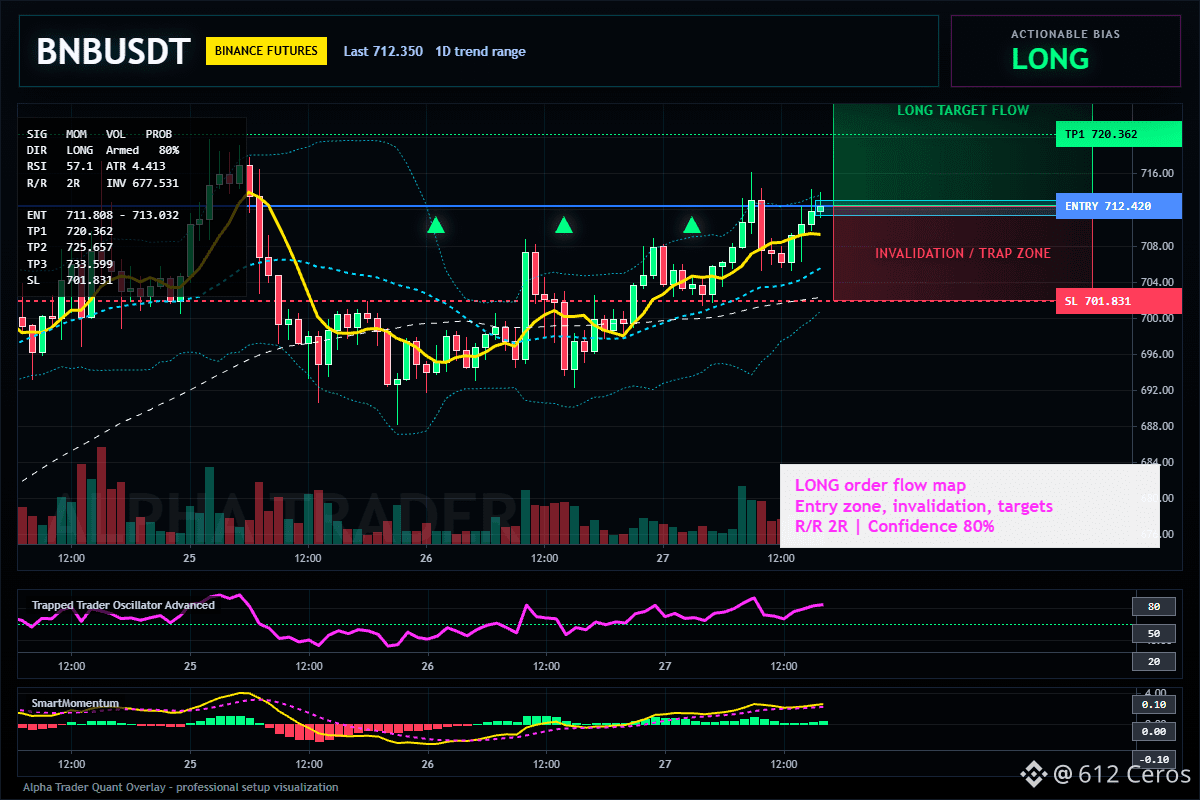
$BNB /USDT - 🟢 LONG · Conf 80%
Trade Plan:
Entry: 711.808 – 713.032
SL: 701.831
TP1: 720.362
TP2: 725.657
TP3: 733.599
Why this setup?
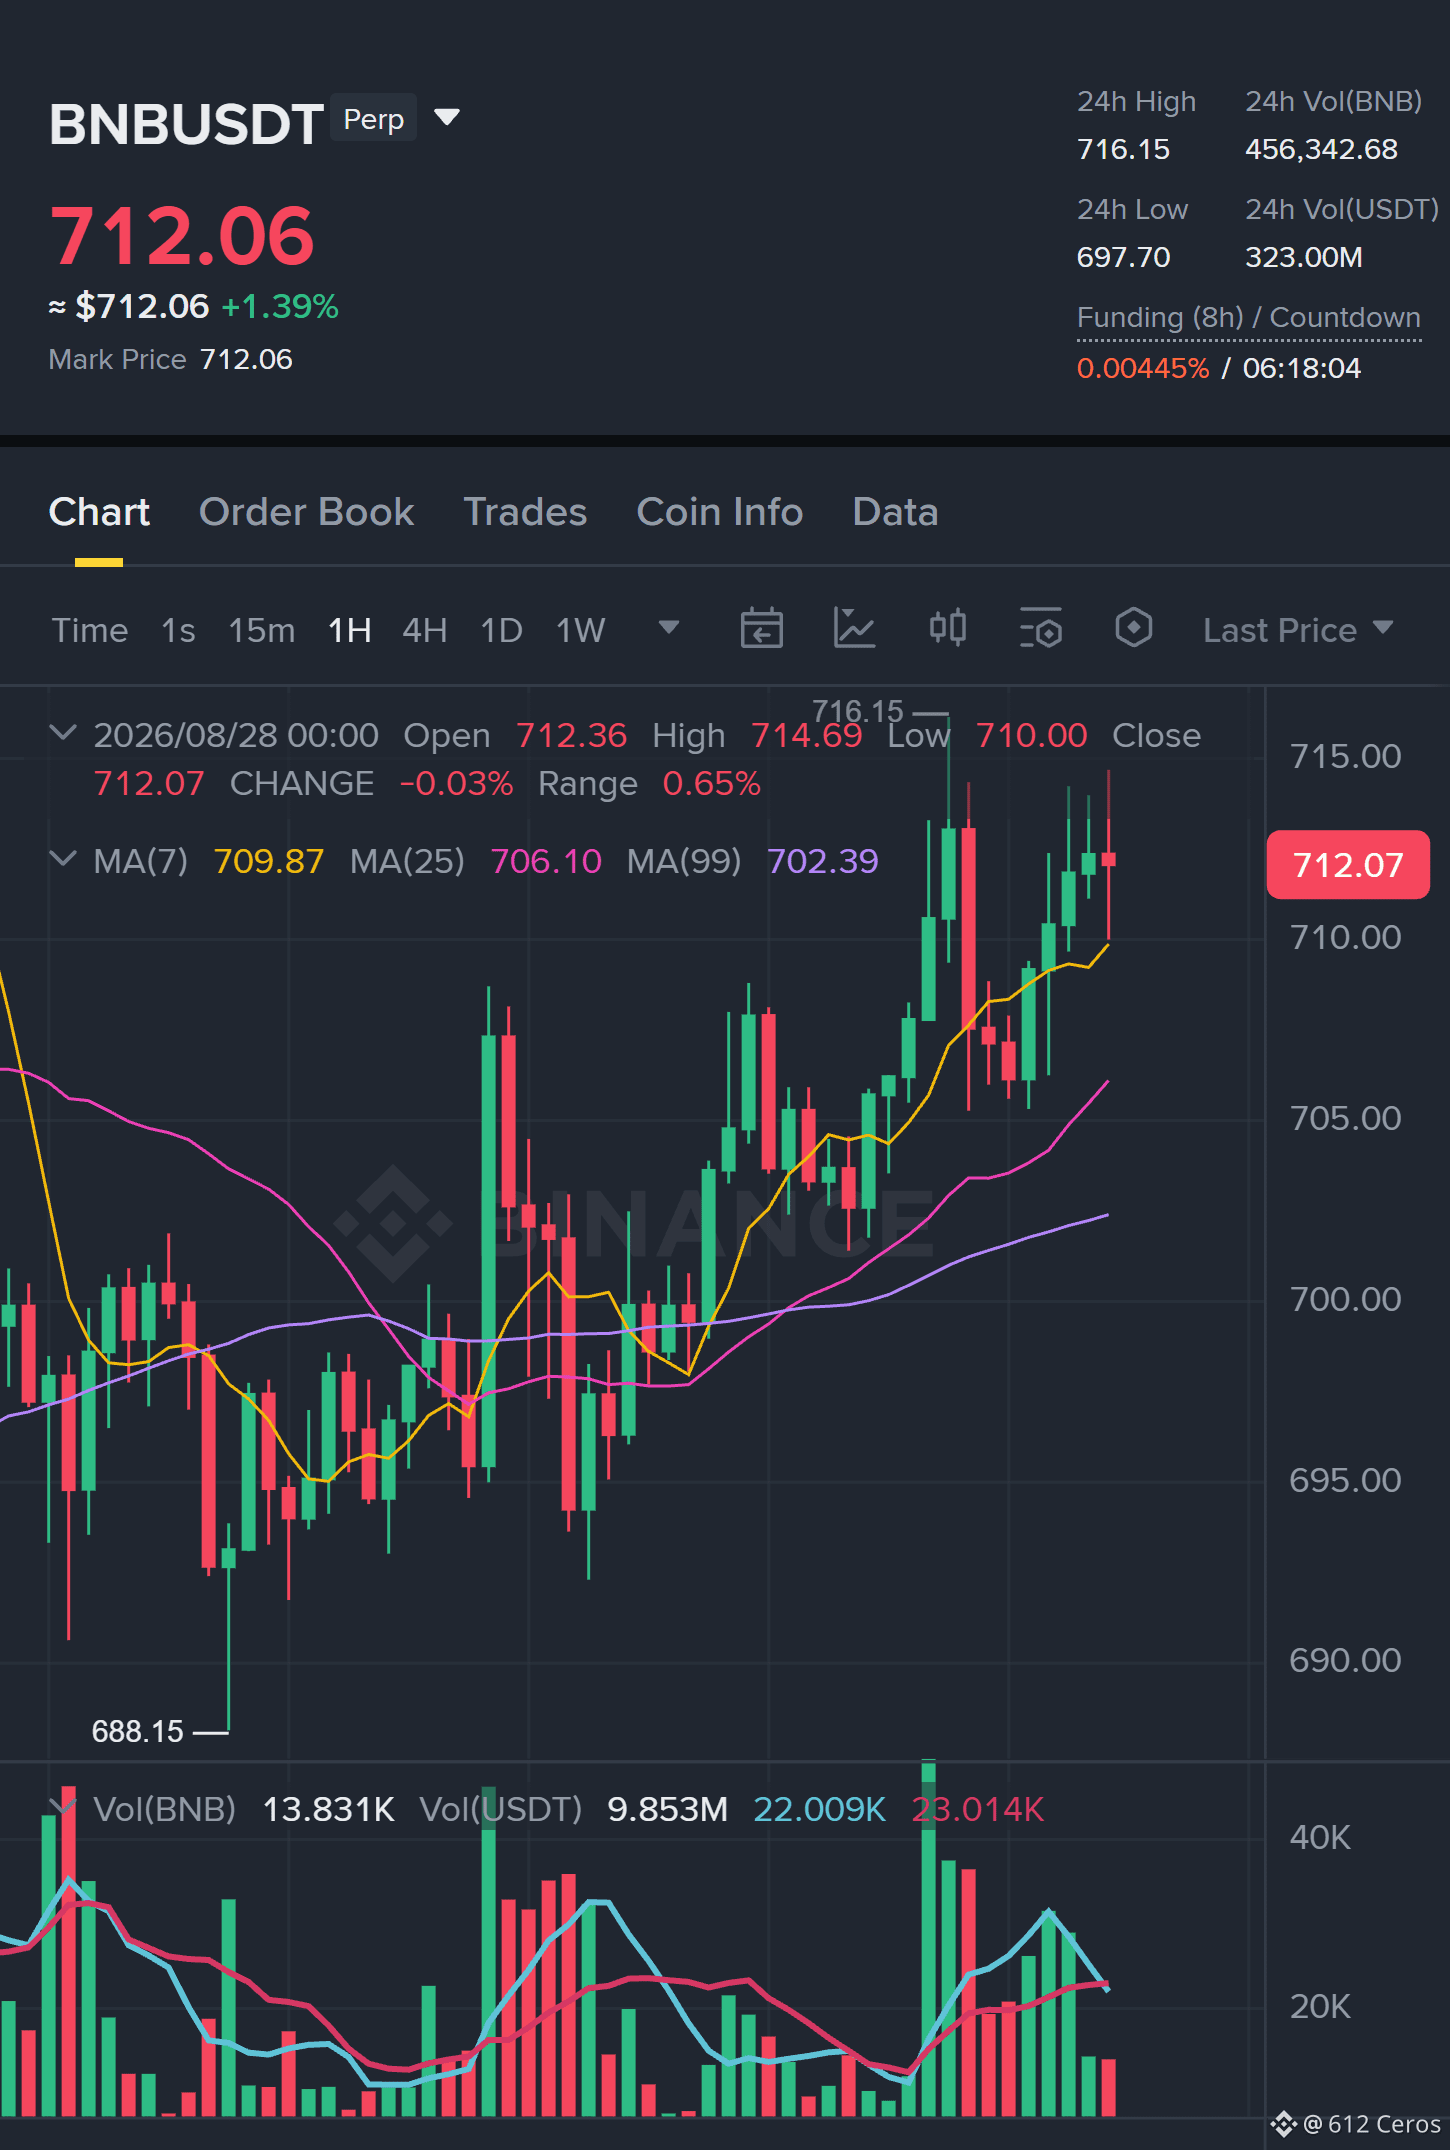
The setup on $BNB is live at 712.420, and the 4h momentum is clearly with the bulls. My model gives it an 80% confidence score, and the RSI on the 15m at 57.13 shows there is still room to run before hitting overbought.
- Why now? The entry zone is tight (711.808 to 713.032), and the ATR on the 1h is only 4.41, meaning the market is coiling for a move.
- Targets are stacked: TP1 at 720.362, TP2 at 725.657, and TP3 at 733.599. The risk-to-reward on the first target alone is nearly 2:1.
- The stop at 701.831 is wide enough to survive noise but tight enough to keep the risk defined.
- This is a trend-following setup on the 4h, but remember, the 1D is in a range. That means we are riding the intraday wave, not betting on a breakout of the bigger picture.
- The edge here is the timing: the 4h structure is pushing up while the daily range gives us a clear ceiling to watch. If we lose 701.831, the thesis is dead.
Debate:
If we hit TP2 at 725.657, do you think the daily range cap will reject us, or is this the start of a new leg up?
Click here to Trade 👇️
$BNB /USDT - 🟢 LONG · Conf 80%
Trade Plan:
Entry: 711.808 – 713.032
SL: 701.831
TP1: 720.362
TP2: 725.657
TP3: 733.599
Why this setup?
The setup on $BNB is live at 712.420, and the 4h momentum is clearly with the bulls. My model gives it an 80% confidence score, and the RSI on the 15m at 57.13 shows there is still room to run before hitting overbought.
- Why now? The entry zone is tight (711.808 to 713.032), and the ATR on the 1h is only 4.41, meaning the market is coiling for a move.
- Targets are stacked: TP1 at 720.362, TP2 at 725.657, and TP3 at 733.599. The risk-to-reward on the first target alone is nearly 2:1.
- The stop at 701.831 is wide enough to survive noise but tight enough to keep the risk defined.
- This is a trend-following setup on the 4h, but remember, the 1D is in a range. That means we are riding the intraday wave, not betting on a breakout of the bigger picture.
- The edge here is the timing: the 4h structure is pushing up while the daily range gives us a clear ceiling to watch. If we lose 701.831, the thesis is dead.
Debate:
If we hit TP2 at 725.657, do you think the daily range cap will reject us, or is this the start of a new leg up?
Click here to Trade 👇️