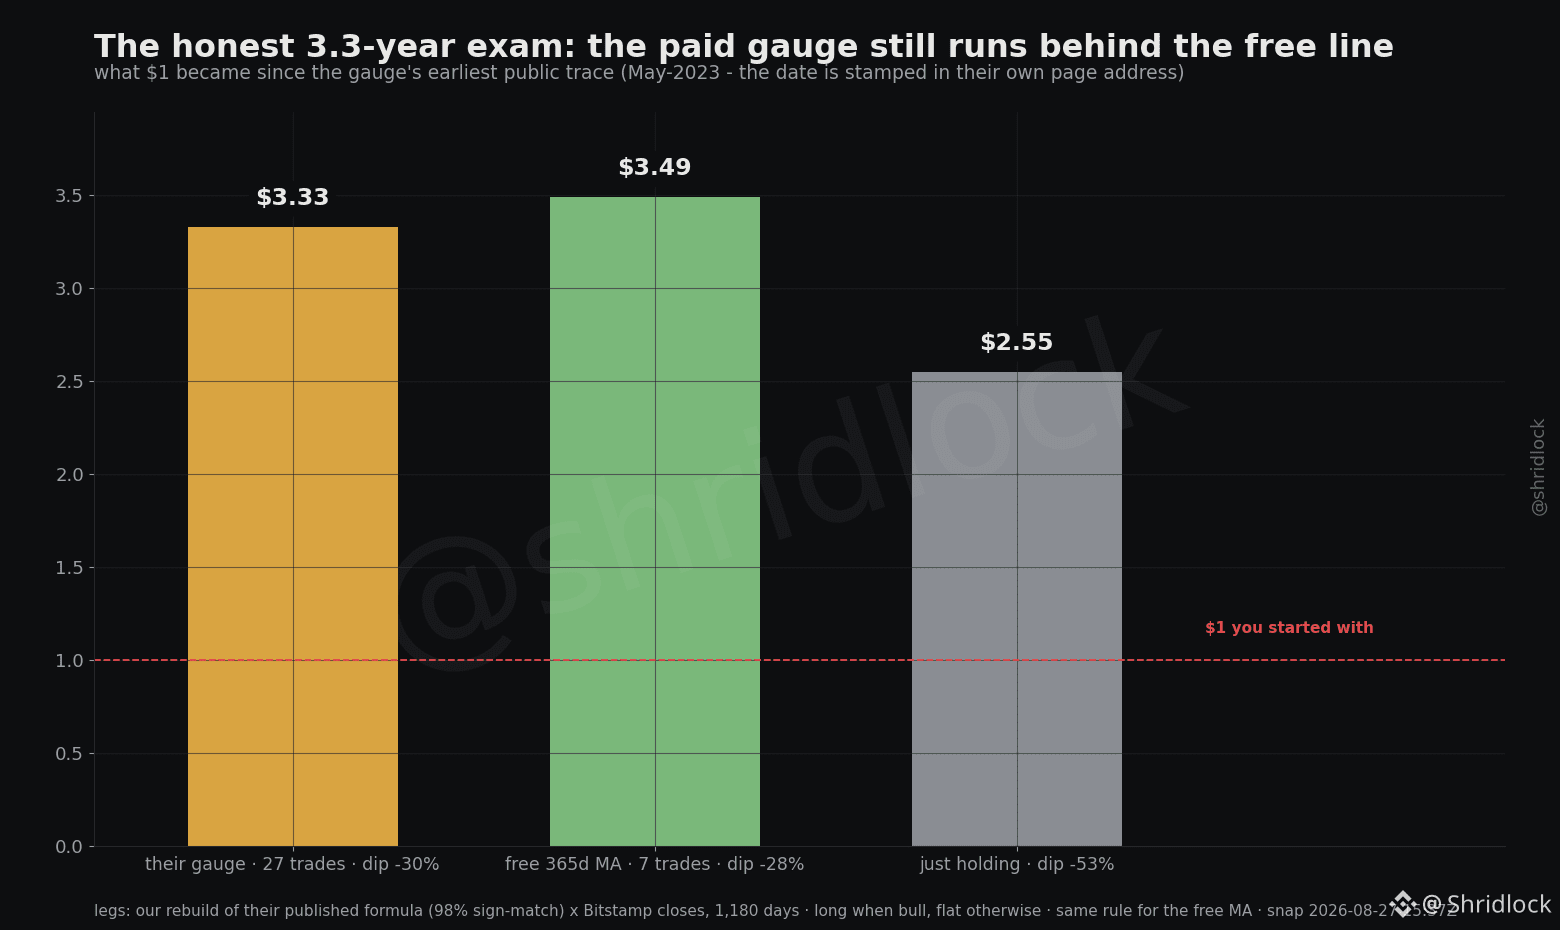
$1 → $3.33. CryptoQuant's Bitcoin P&L Index gauge, last 3.3 years.
$1 → $3.49. A free moving average, same days. Seven trades against their twenty-seven.
Why 3.3 years and not their full chart? Because a forecaster is only on the record from the day he starts speaking OUT LOUD. Their chart "predicts" 2014 - but everything before the gauge existed is a diary written after the match.
So the first thing we hunted was its birthday. It is stamped right in their page's address - like the year in a car's VIN. First trace: a May-2023 strategy query on their own platform. The dashboard, by their own analyst: Feb-2024.
We cut at the earliest date - maximum credit to them. On the out-loud years: the paid signal runs behind a free line. Both dodge crashes (-30% / -28% vs -53% just holding). That part works. The edge doesn't.
Their "bottom is in" calls? Eleven of the last twelve saw lower prices within 90 days.
Don't grade the diary. Grade the record. NFA
$BTC
$1 → $3.49. A free moving average, same days. Seven trades against their twenty-seven.
Why 3.3 years and not their full chart? Because a forecaster is only on the record from the day he starts speaking OUT LOUD. Their chart "predicts" 2014 - but everything before the gauge existed is a diary written after the match.
So the first thing we hunted was its birthday. It is stamped right in their page's address - like the year in a car's VIN. First trace: a May-2023 strategy query on their own platform. The dashboard, by their own analyst: Feb-2024.
We cut at the earliest date - maximum credit to them. On the out-loud years: the paid signal runs behind a free line. Both dodge crashes (-30% / -28% vs -53% just holding). That part works. The edge doesn't.
Their "bottom is in" calls? Eleven of the last twelve saw lower prices within 90 days.
Don't grade the diary. Grade the record. NFA
$BTC