"Rallies like this in bear markets usually signal the bottom is in." - CryptoQuant's CEO, Aug-21. His own gauge flipped bull that same day.
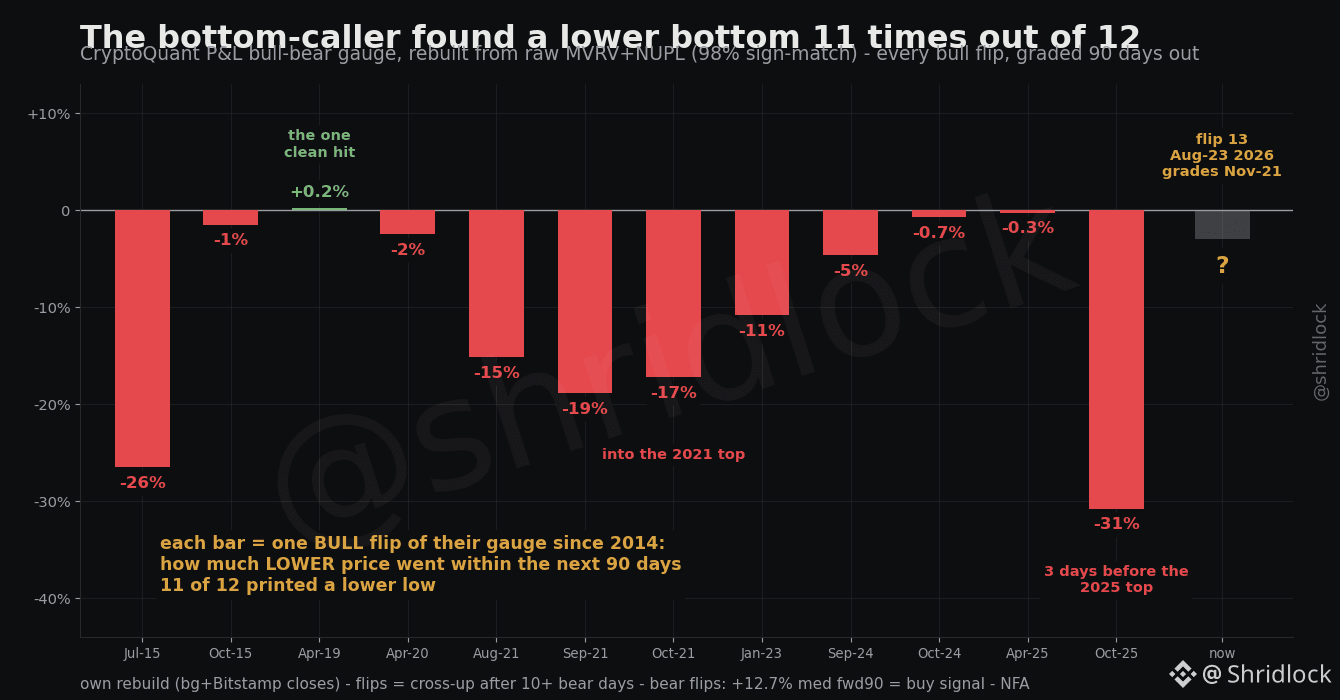
We rebuilt the gauge from its three published components - MVRV, NUPL and the LTH/STH SOPR pair. The SOPR pair does nothing: zero refit weight, R2 identical without it. MVRV + NUPL are the whole machine - 98% sign-match. A flip is their published rule: the index crossing its own 365-day MA. We graded every $BTC bull flip since 2014. All twelve:
11 of 12 found a LOWER bottom within 90 days - seven of them 4% to 31% deeper. The loudest fired into cycle tops: Oct-2021, and Oct-3 2025 - three days before the peak, then -31%.
The bear flips were a buy signal: +12.7% median 90 days later - double the +6.2% market base. Up 13 of 18.
No lag rescue - delay entry 10, 30, 60 days and the edge decays: 25% > 20% > 10% > negative. We ran it linear too: as a continuous read the gauge does carry momentum information (rank IC 0.13-0.26). What fails is the product - the FLIP sold as a bottom call. A plain price-over-yearly-MA cross beats that on a month: +11.9% vs +2.0%.
The strange part: the team that built it owns every data point above. This scoreboard was one query away. Why publish the signal and not the score?
Early is the expensive word for wrong. Charted below. Could anyone have actually made money on this gauge? Next post. NFA
We rebuilt the gauge from its three published components - MVRV, NUPL and the LTH/STH SOPR pair. The SOPR pair does nothing: zero refit weight, R2 identical without it. MVRV + NUPL are the whole machine - 98% sign-match. A flip is their published rule: the index crossing its own 365-day MA. We graded every $BTC bull flip since 2014. All twelve:
11 of 12 found a LOWER bottom within 90 days - seven of them 4% to 31% deeper. The loudest fired into cycle tops: Oct-2021, and Oct-3 2025 - three days before the peak, then -31%.
The bear flips were a buy signal: +12.7% median 90 days later - double the +6.2% market base. Up 13 of 18.
No lag rescue - delay entry 10, 30, 60 days and the edge decays: 25% > 20% > 10% > negative. We ran it linear too: as a continuous read the gauge does carry momentum information (rank IC 0.13-0.26). What fails is the product - the FLIP sold as a bottom call. A plain price-over-yearly-MA cross beats that on a month: +11.9% vs +2.0%.
The strange part: the team that built it owns every data point above. This scoreboard was one query away. Why publish the signal and not the score?
Early is the expensive word for wrong. Charted below. Could anyone have actually made money on this gauge? Next post. NFA