$BTC
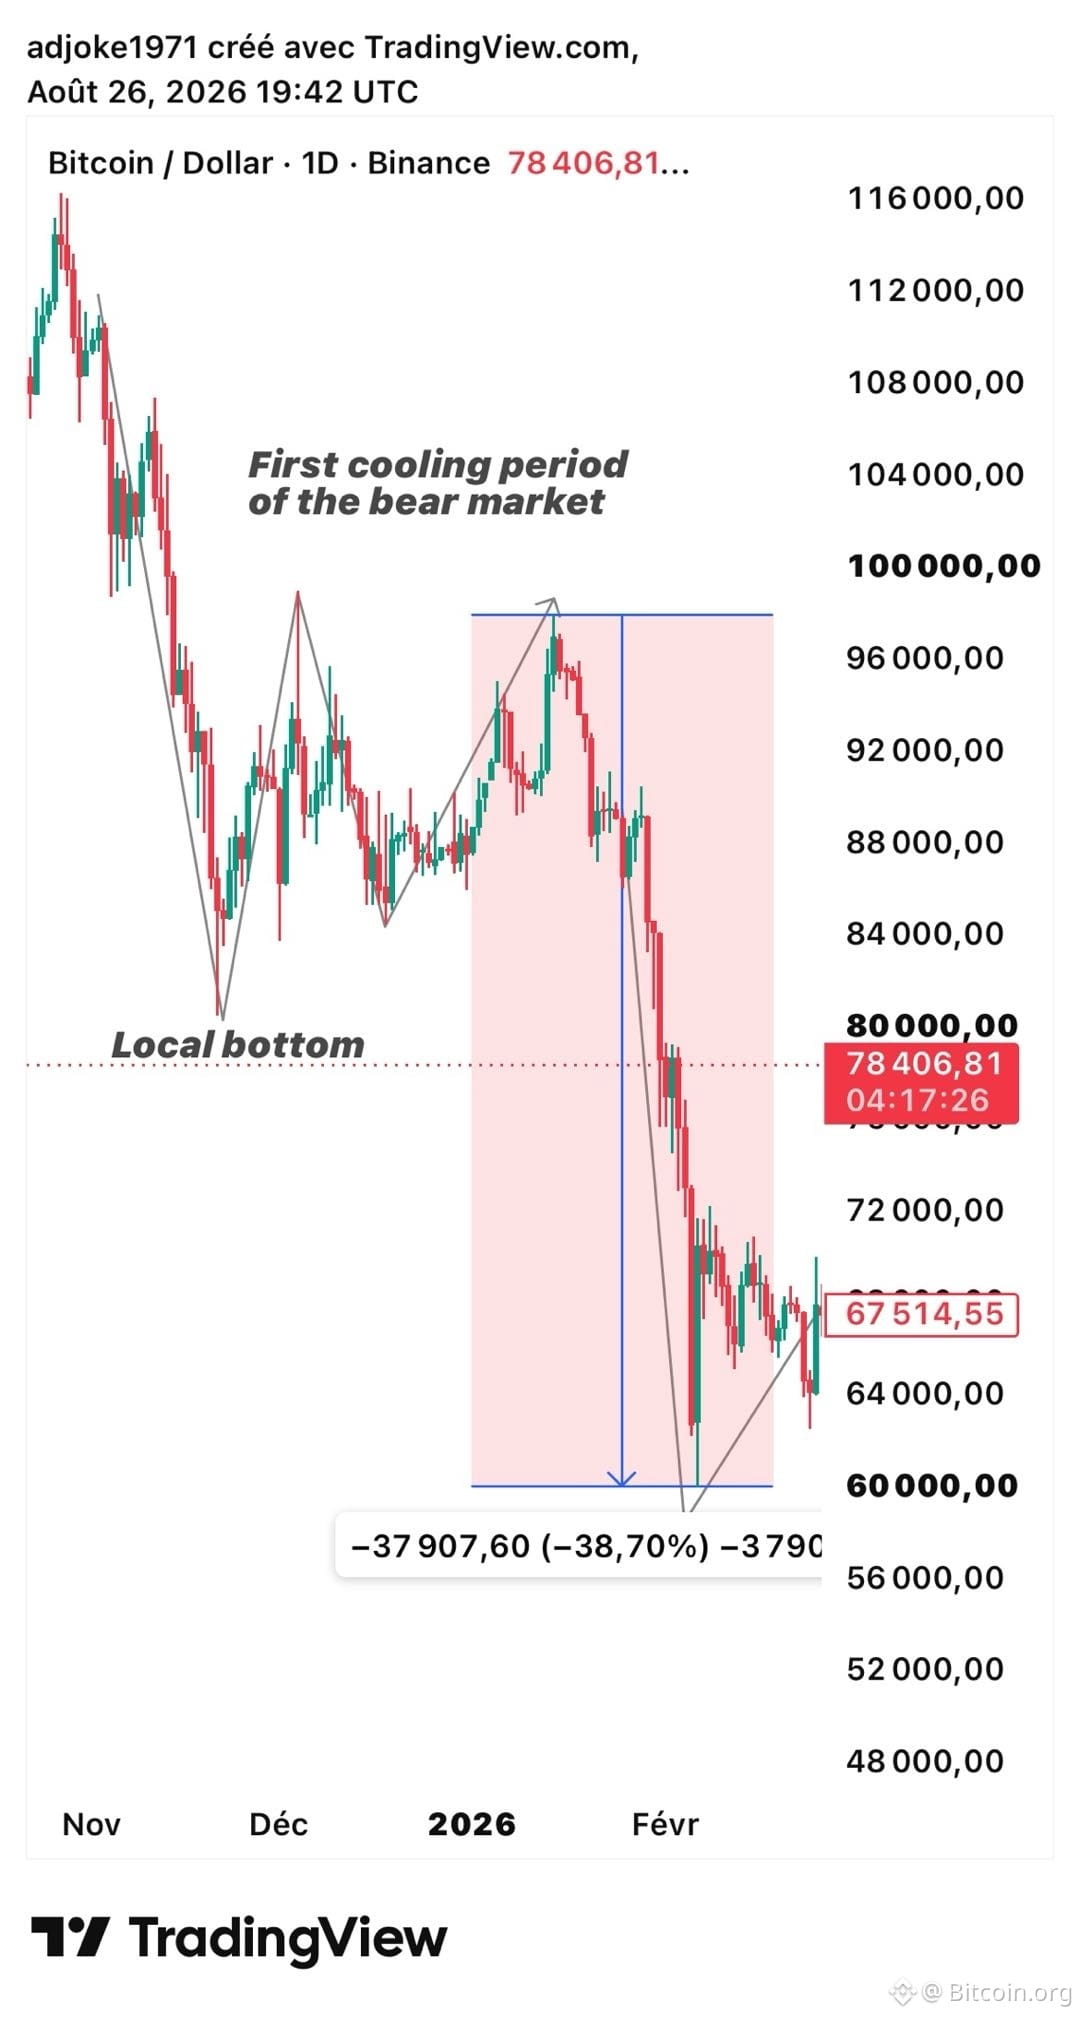
Throughout this bear market, each major consolidation phase has followed a similar sequence: a cooling period, followed by another strong bearish impulse.
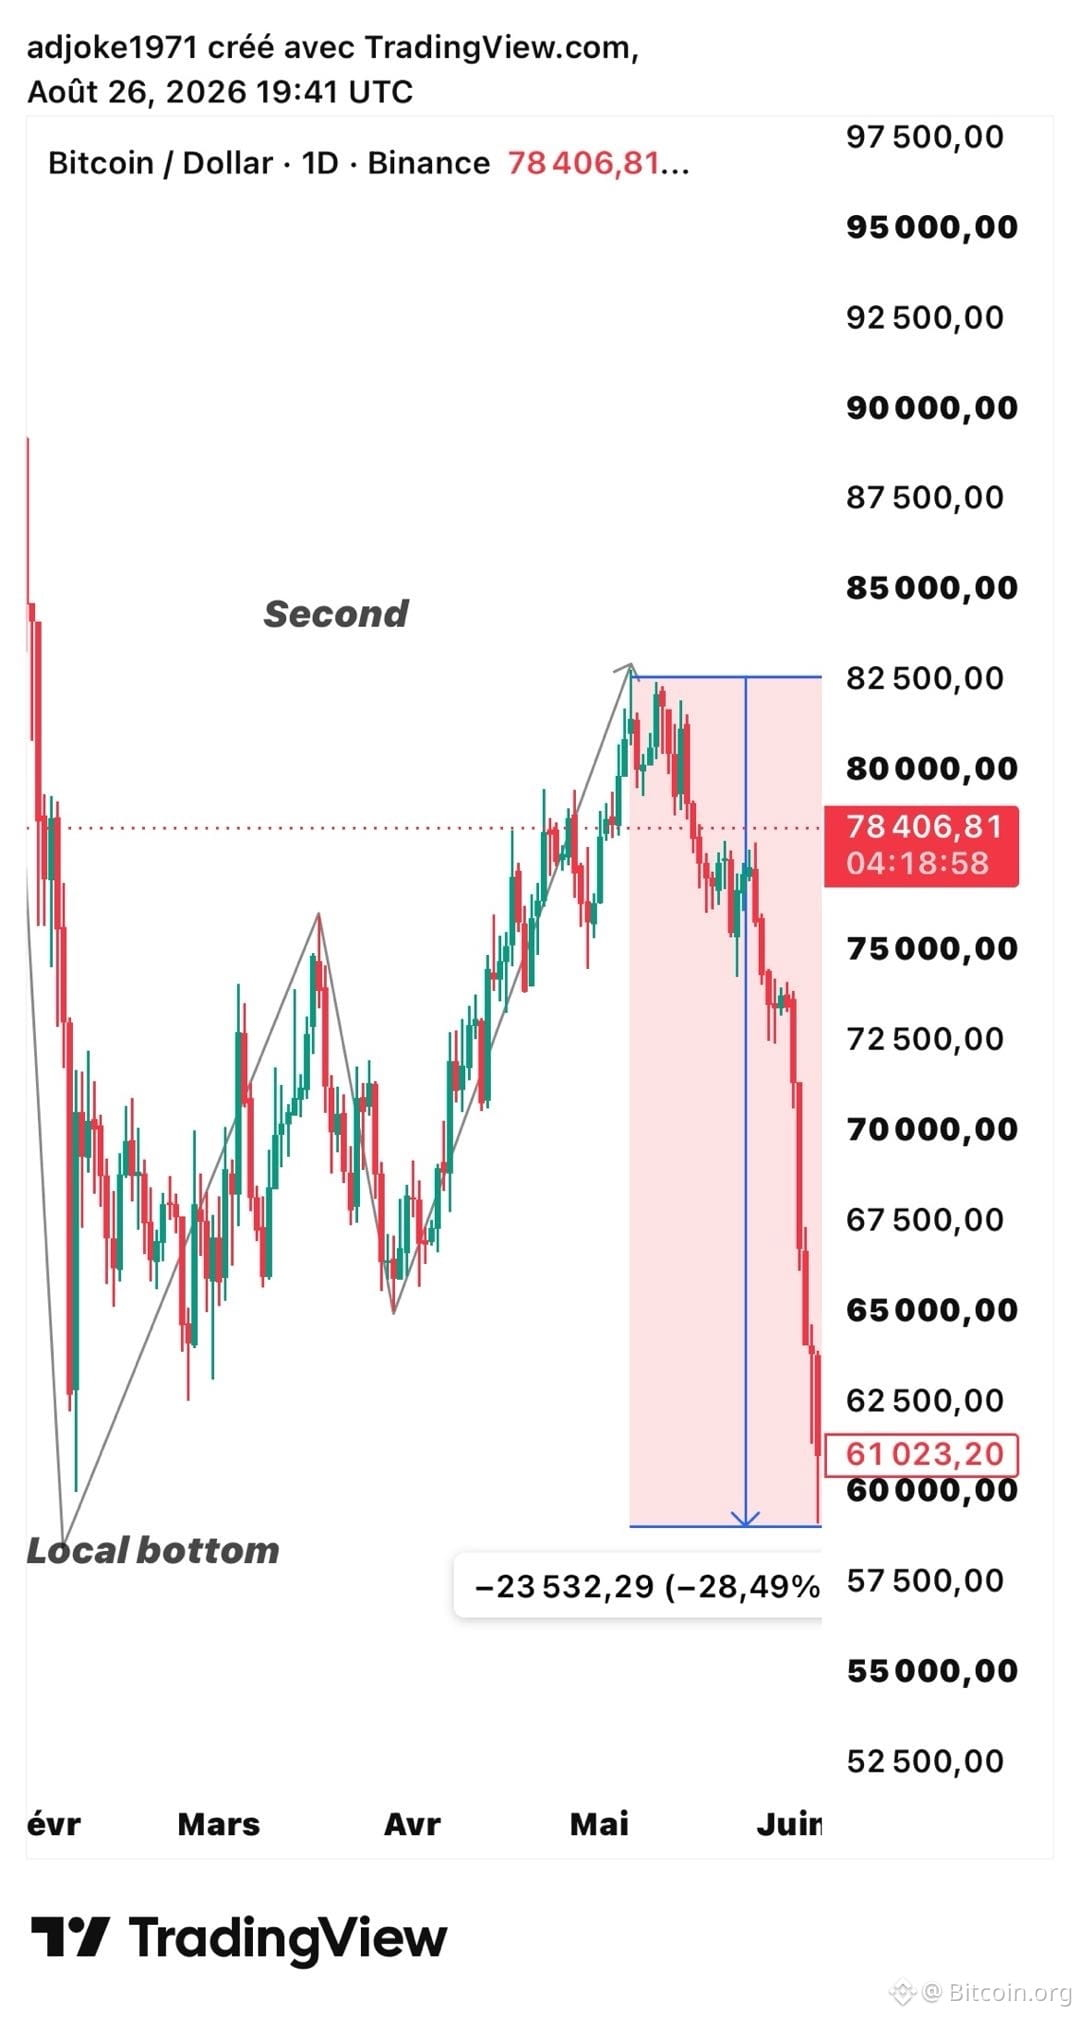
We saw it during the initial breakdown, after the first major consolidation, and again after the previous recovery — when BTC rallied from roughly $60K to $83K, briefly creating the impression that the bull market was returning before the move failed.
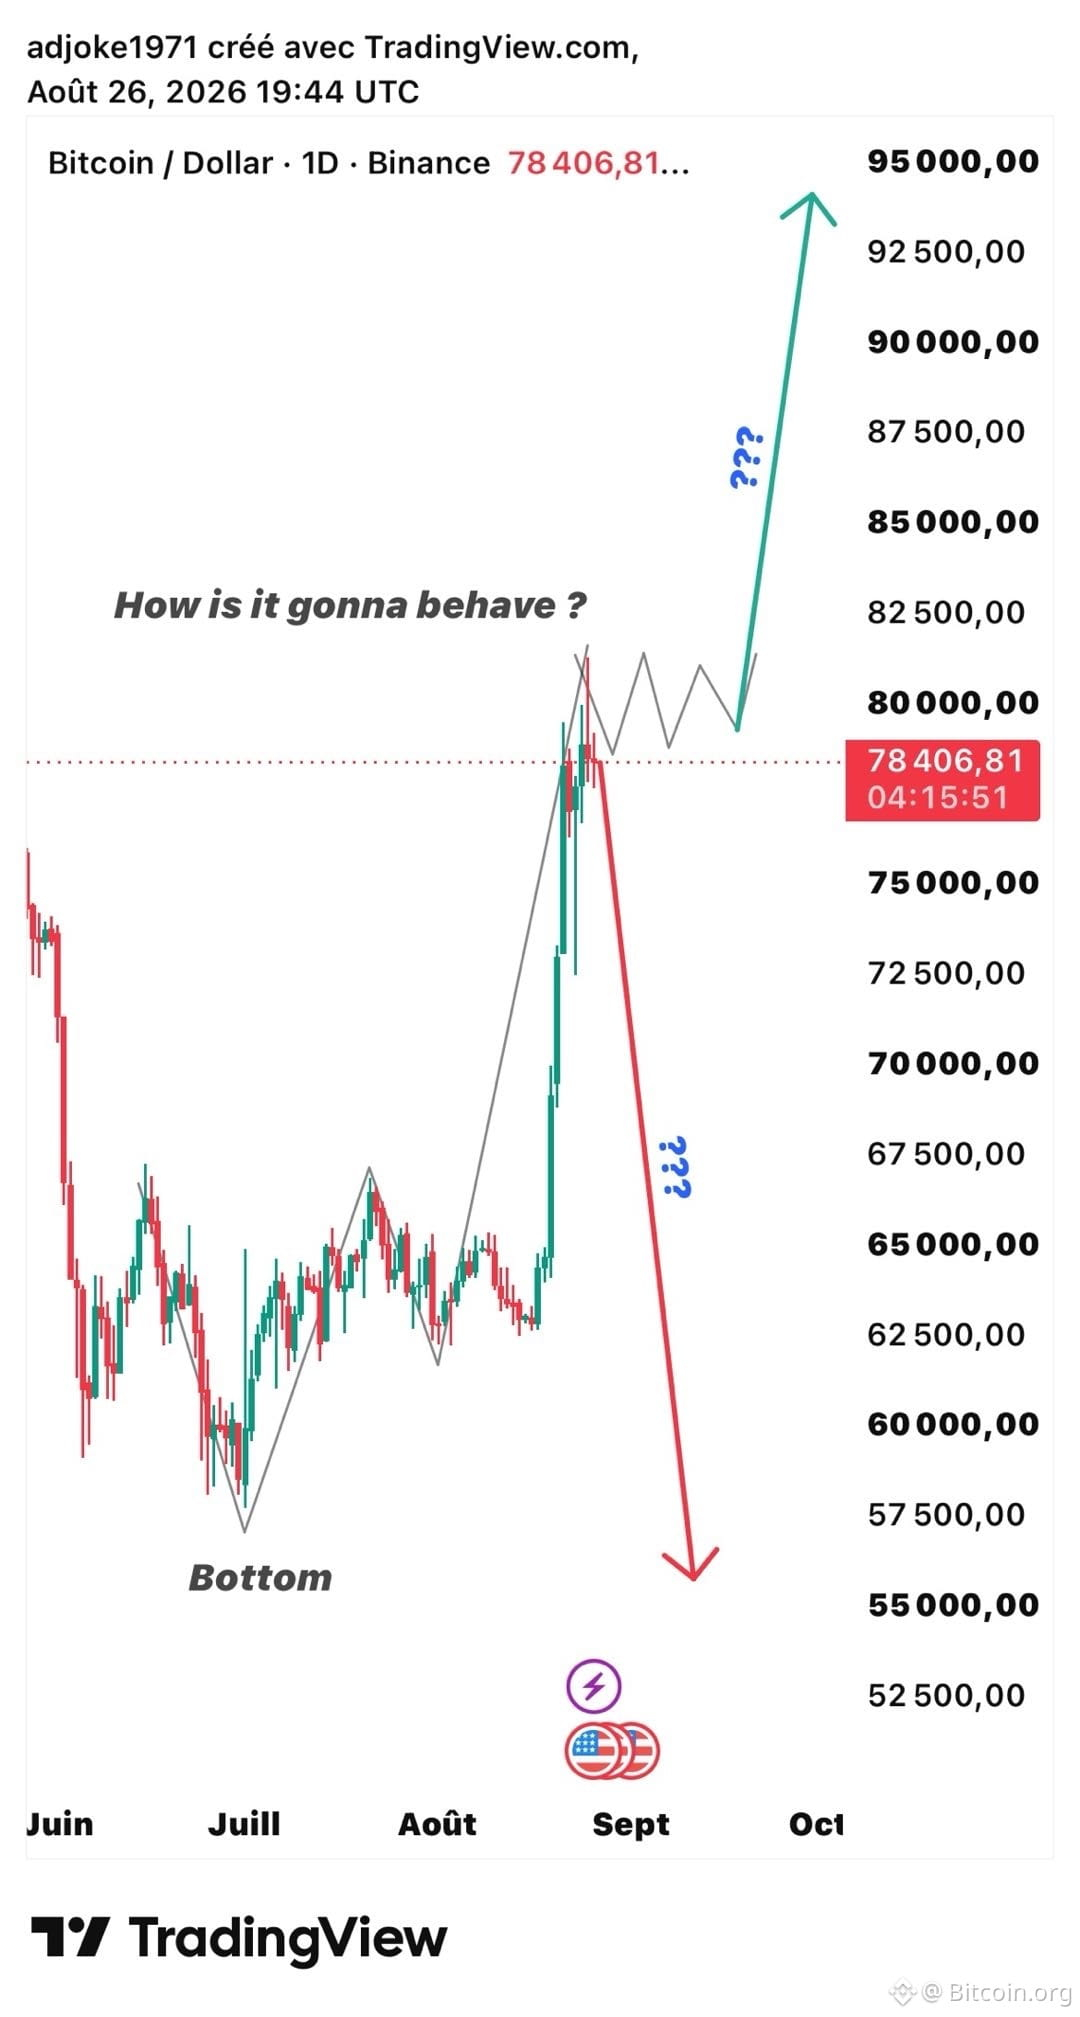
The current setup is different in one important respect: Bitcoin has just recorded a 20%+ weekly move, something that has been relatively unusual during this bear market.
Combined with several other indicators suggesting that the broader bearish cycle may be approaching its end, this makes the current structure particularly interesting.
However, technical analysis ultimately comes down to price structure.
The previous moves can be interpreted through a classic trend sequence: impulse → correction → impulse → correction. The consolidations were corrections, while the subsequent sell-offs represented new bearish impulses.
The key question now is whether the market repeats that sequence.
I’m therefore watching the next move after this bullish impulse. If the daily structure fails to reverse and we don’t see another strong bearish expansion comparable to previous cycles, that would significantly weaken the bearish thesis.
At that point, I would personally assign a 98–99% probability that the bear market has already ended.
Until then, the chart remains the final judge.
Let’s follow the price.
#BTC Price Analysis# #Macro Insights# #Altcoin Season#
Throughout this bear market, each major consolidation phase has followed a similar sequence: a cooling period, followed by another strong bearish impulse.
We saw it during the initial breakdown, after the first major consolidation, and again after the previous recovery — when BTC rallied from roughly $60K to $83K, briefly creating the impression that the bull market was returning before the move failed.
The current setup is different in one important respect: Bitcoin has just recorded a 20%+ weekly move, something that has been relatively unusual during this bear market.
Combined with several other indicators suggesting that the broader bearish cycle may be approaching its end, this makes the current structure particularly interesting.
However, technical analysis ultimately comes down to price structure.
The previous moves can be interpreted through a classic trend sequence: impulse → correction → impulse → correction. The consolidations were corrections, while the subsequent sell-offs represented new bearish impulses.
The key question now is whether the market repeats that sequence.
I’m therefore watching the next move after this bullish impulse. If the daily structure fails to reverse and we don’t see another strong bearish expansion comparable to previous cycles, that would significantly weaken the bearish thesis.
At that point, I would personally assign a 98–99% probability that the bear market has already ended.
Until then, the chart remains the final judge.
Let’s follow the price.
#BTC Price Analysis# #Macro Insights# #Altcoin Season#