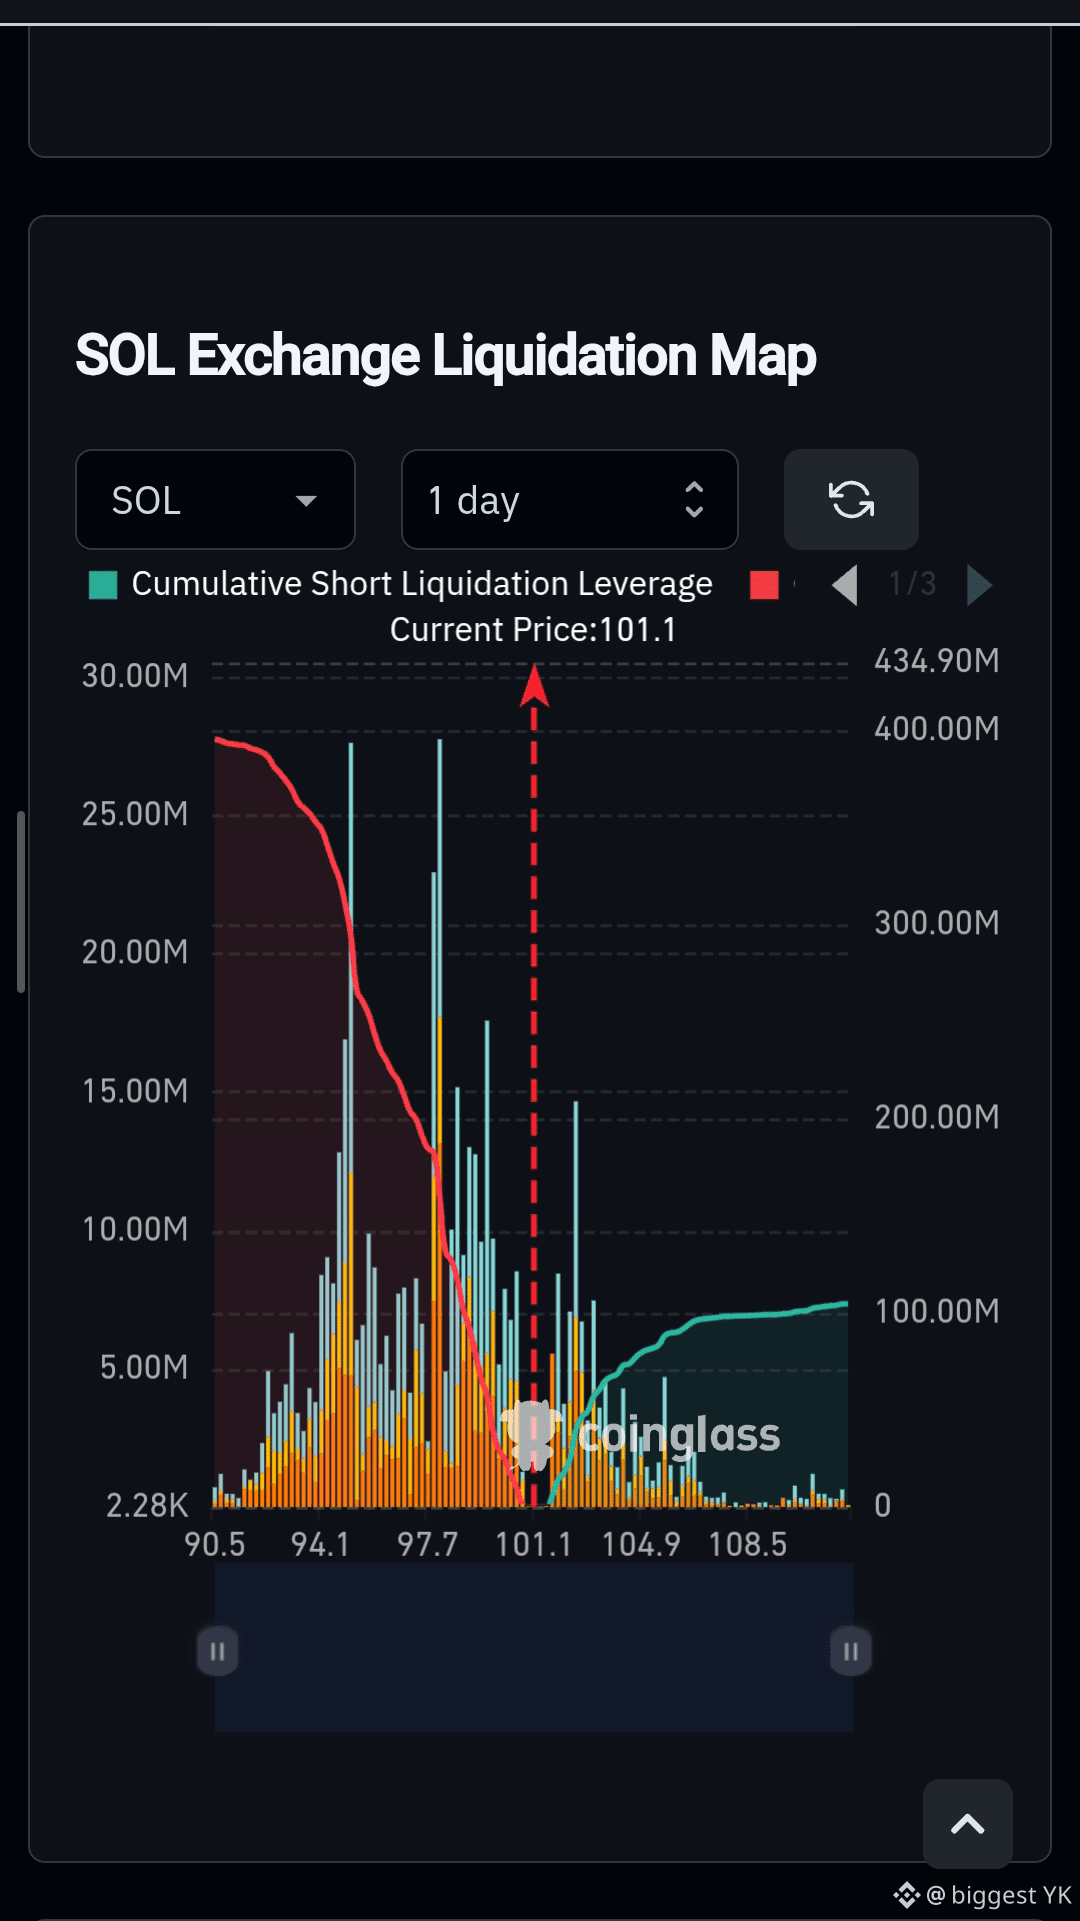
$SOL LIQUIDATION MAP IS SHOWING AN INTERESTING SETUP 👀
SOL is currently around $101.1.
Looking at the 1-day Coinglass liquidation map:
🔴 Below $101:
There is a much larger concentration of potential long liquidations, particularly around the $94–$98 area and extending lower.
🟢 Above $101:
Short liquidation liquidity starts building as SOL moves higher, with notable clusters around $103–$106+.
What matters:
If SOL breaks higher and momentum accelerates, the short liquidity above price could fuel a short squeeze as leveraged shorts are forced to close.
But there is a bigger downside liquidation pool below the current price.
So the map is basically saying:
$103–$106 → potential short-squeeze zone
$94–$98 → major long-liquidation zone
The liquidation map does NOT predict direction by itself. It shows where leverage can amplify a move.
I’d be watching $101–$103 closely for the next expansion.
Are you expecting SOL to hunt the shorts above or the longs below? 👇
SOL is currently around $101.1.
Looking at the 1-day Coinglass liquidation map:
🔴 Below $101:
There is a much larger concentration of potential long liquidations, particularly around the $94–$98 area and extending lower.
🟢 Above $101:
Short liquidation liquidity starts building as SOL moves higher, with notable clusters around $103–$106+.
What matters:
If SOL breaks higher and momentum accelerates, the short liquidity above price could fuel a short squeeze as leveraged shorts are forced to close.
But there is a bigger downside liquidation pool below the current price.
So the map is basically saying:
$103–$106 → potential short-squeeze zone
$94–$98 → major long-liquidation zone
The liquidation map does NOT predict direction by itself. It shows where leverage can amplify a move.
I’d be watching $101–$103 closely for the next expansion.
Are you expecting SOL to hunt the shorts above or the longs below? 👇