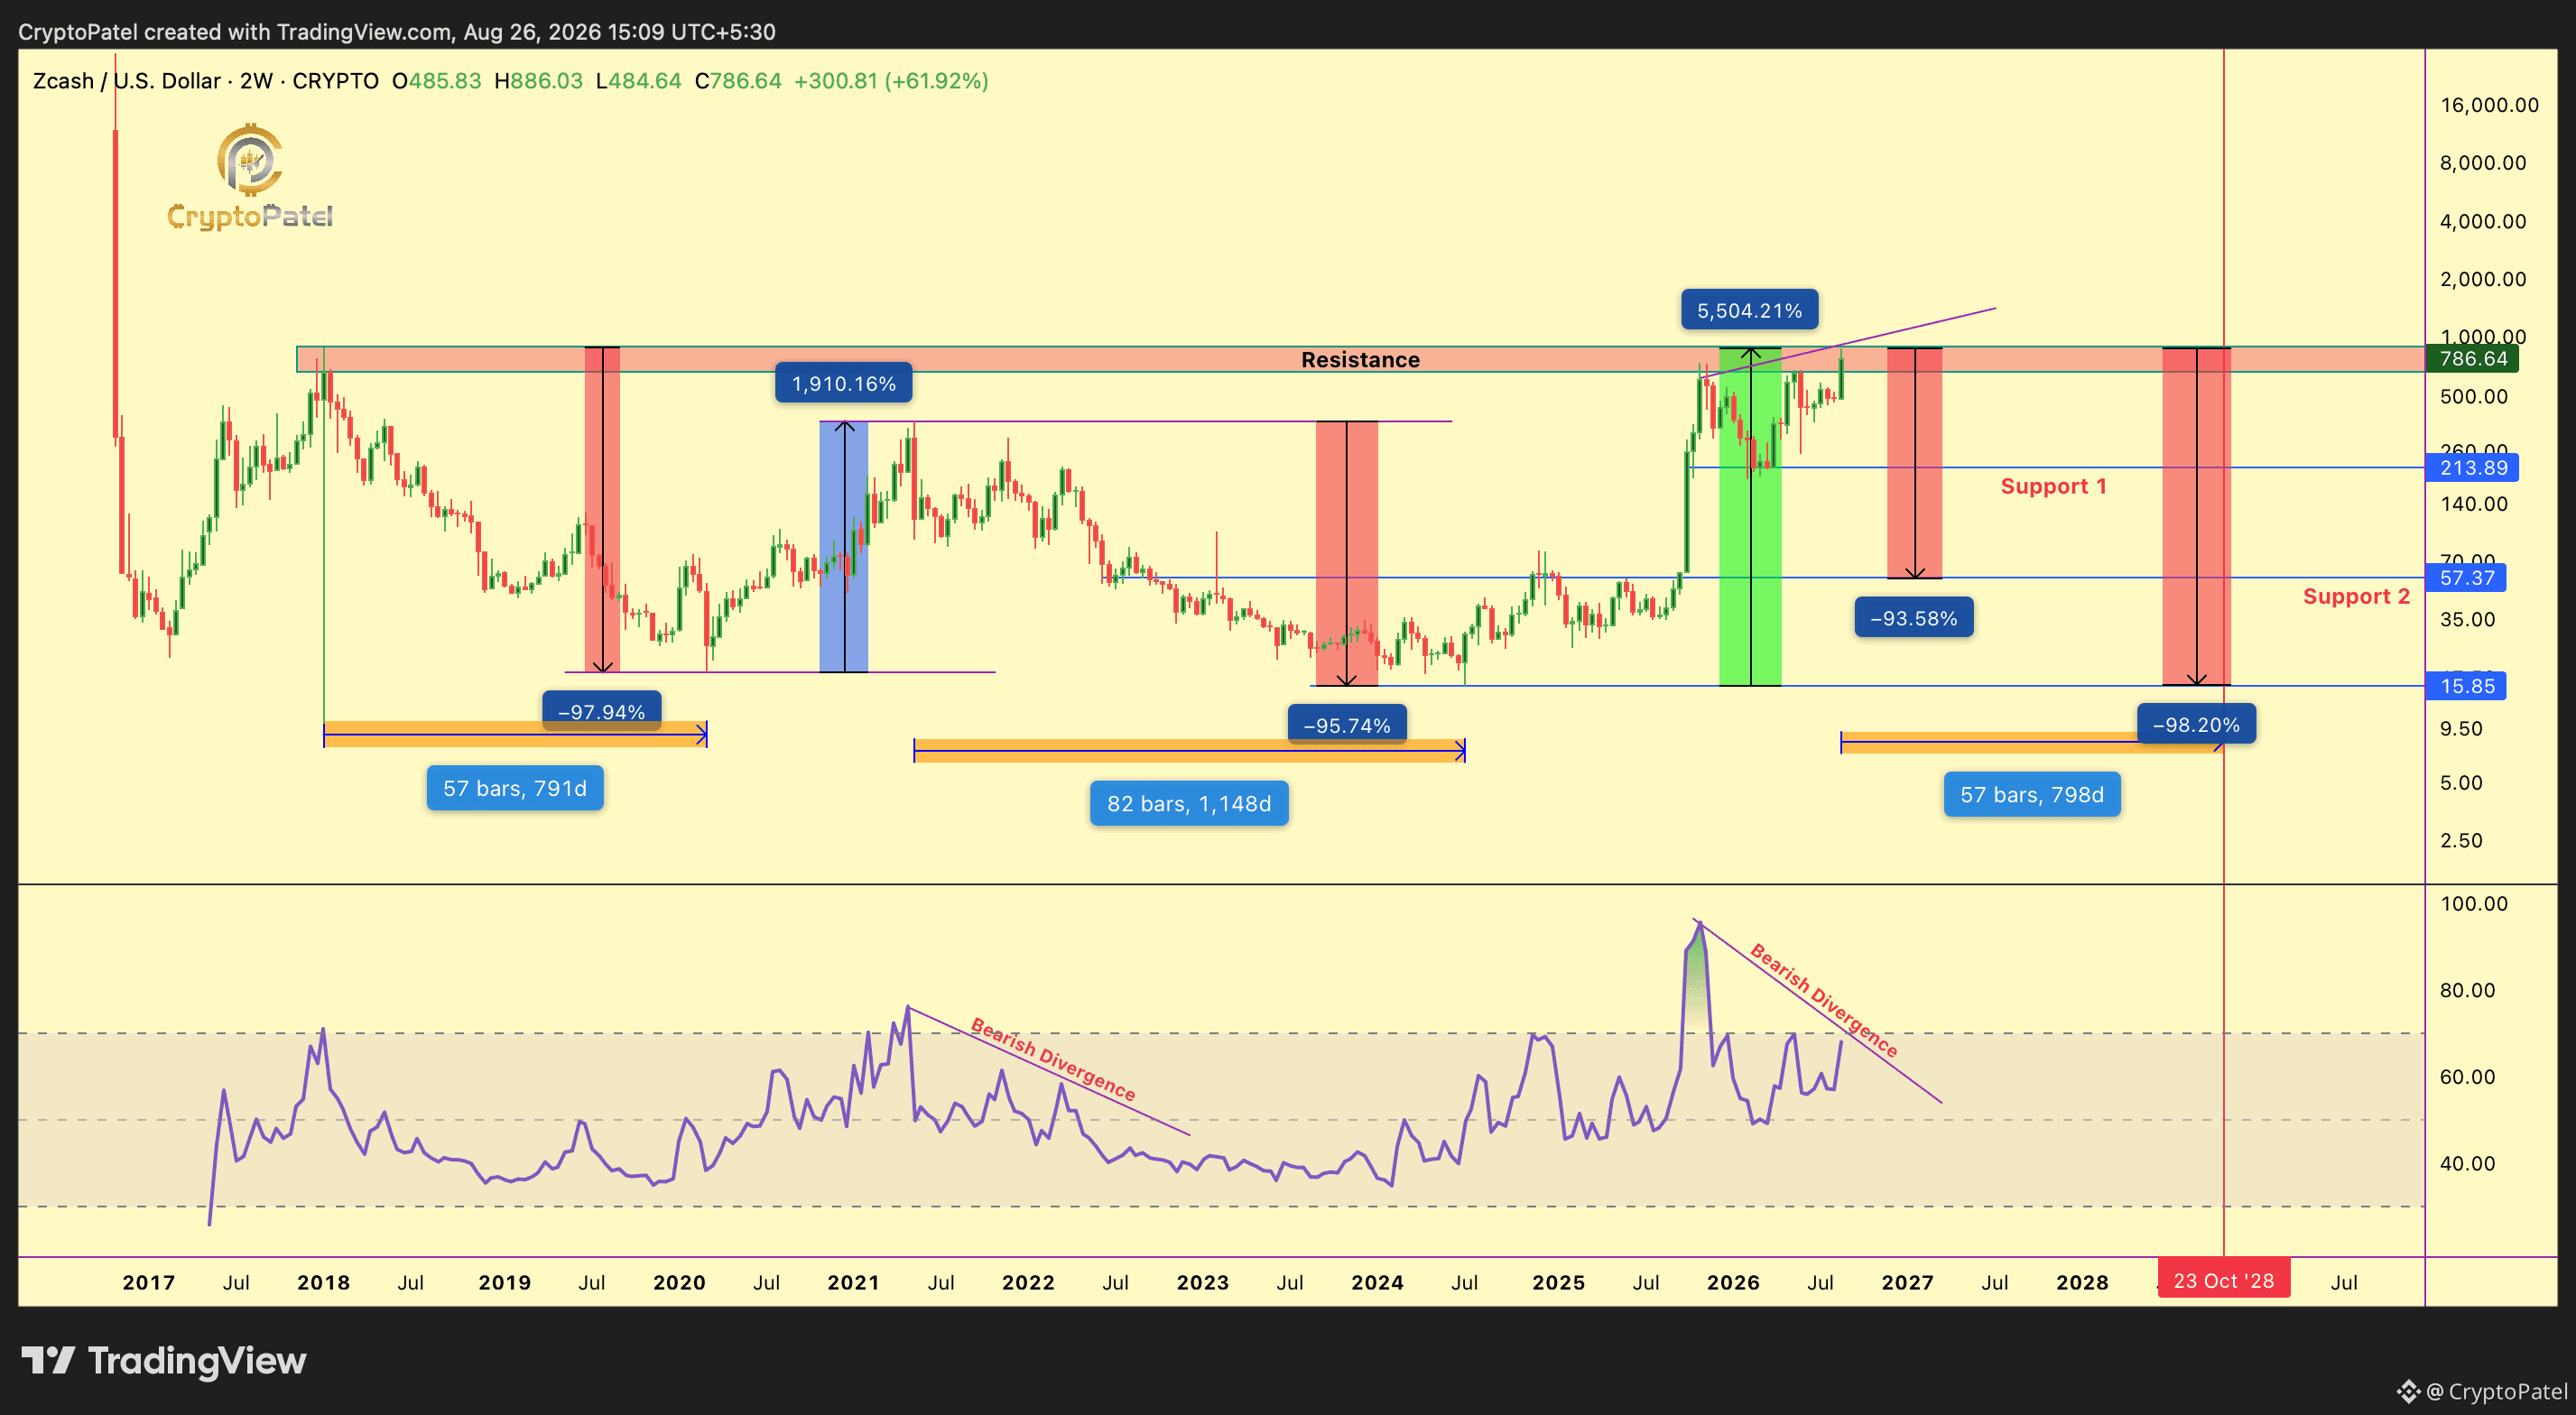

$ZEC : A 2W Structural Breakout Or Another 98% Distribution Cycle?
The Full #ZEC Chart Shows A Clear Repeating Structure:
1️⃣ 2017–2018: $22 → $900 = ~4,000% Rally
➡️ Then Distribution: $900 → $18.50 = ~98% Crash
2️⃣ 2020–2021: $18.50 → $372 = ~1,900% Rally
➡️ Then Distribution: $372 → $15.85 = ~96% Crash
3️⃣ Current Cycle: Accumulation Started Near $15.85 In July 2024.
➡️ Since Then, ZEC Has Exploded Toward $888+ And Now Trades Near ATH.
The Timing Matters.
🇺🇸 Grayscale's Spot Zcash ETF Started Trading On NYSE Arca On August 25. The Major News Is No Longer A Rumour, It Is Already Live.
And This Is Where I Become Cautious. “Buy The Rumour, Sell The News.”
Price Is Near A Major Historical Resistance Zone Around $800–$900, While RSI Is Showing Bearish Divergence And Not Confirming The Strength Of This Pump.
I Am NOT Saying ZEC Cannot Go Higher.
But Based On Its Historical Cycle Behaviour, I Believe Downside Risk Is Much Higher Than The Upside Risk At $800–$900.
My Strategy:
❌ I Am Not Buying ZEC At $800–$900 Or Chasing Higher.
🔻 I Am Watching For Confirmed Short Opportunities.
▶️ Long-Term, I Am Watching The $50–$100 Zone For Potential Accumulation Over The Next 1–3 Years.
If $900 Breaks, Holds, And Converts Into Support, I Will Reassess.
Until Then, I Prefer Capital Protection Over FOMO.
Ask Yourself: Would You Rather Buy ZEC At $900 After A Massive Expansion Or Accumulate It Under $20 Like The Previous Cycle?
Think About The Risk/Reward Before You Click Buy.
Trade The Structure. Not The Hype.
#CryptoPatel
The Full #ZEC Chart Shows A Clear Repeating Structure:
1️⃣ 2017–2018: $22 → $900 = ~4,000% Rally
➡️ Then Distribution: $900 → $18.50 = ~98% Crash
2️⃣ 2020–2021: $18.50 → $372 = ~1,900% Rally
➡️ Then Distribution: $372 → $15.85 = ~96% Crash
3️⃣ Current Cycle: Accumulation Started Near $15.85 In July 2024.
➡️ Since Then, ZEC Has Exploded Toward $888+ And Now Trades Near ATH.
The Timing Matters.
🇺🇸 Grayscale's Spot Zcash ETF Started Trading On NYSE Arca On August 25. The Major News Is No Longer A Rumour, It Is Already Live.
And This Is Where I Become Cautious. “Buy The Rumour, Sell The News.”
Price Is Near A Major Historical Resistance Zone Around $800–$900, While RSI Is Showing Bearish Divergence And Not Confirming The Strength Of This Pump.
I Am NOT Saying ZEC Cannot Go Higher.
But Based On Its Historical Cycle Behaviour, I Believe Downside Risk Is Much Higher Than The Upside Risk At $800–$900.
My Strategy:
❌ I Am Not Buying ZEC At $800–$900 Or Chasing Higher.
🔻 I Am Watching For Confirmed Short Opportunities.
▶️ Long-Term, I Am Watching The $50–$100 Zone For Potential Accumulation Over The Next 1–3 Years.
If $900 Breaks, Holds, And Converts Into Support, I Will Reassess.
Until Then, I Prefer Capital Protection Over FOMO.
Ask Yourself: Would You Rather Buy ZEC At $900 After A Massive Expansion Or Accumulate It Under $20 Like The Previous Cycle?
Think About The Risk/Reward Before You Click Buy.
Trade The Structure. Not The Hype.
#CryptoPatel