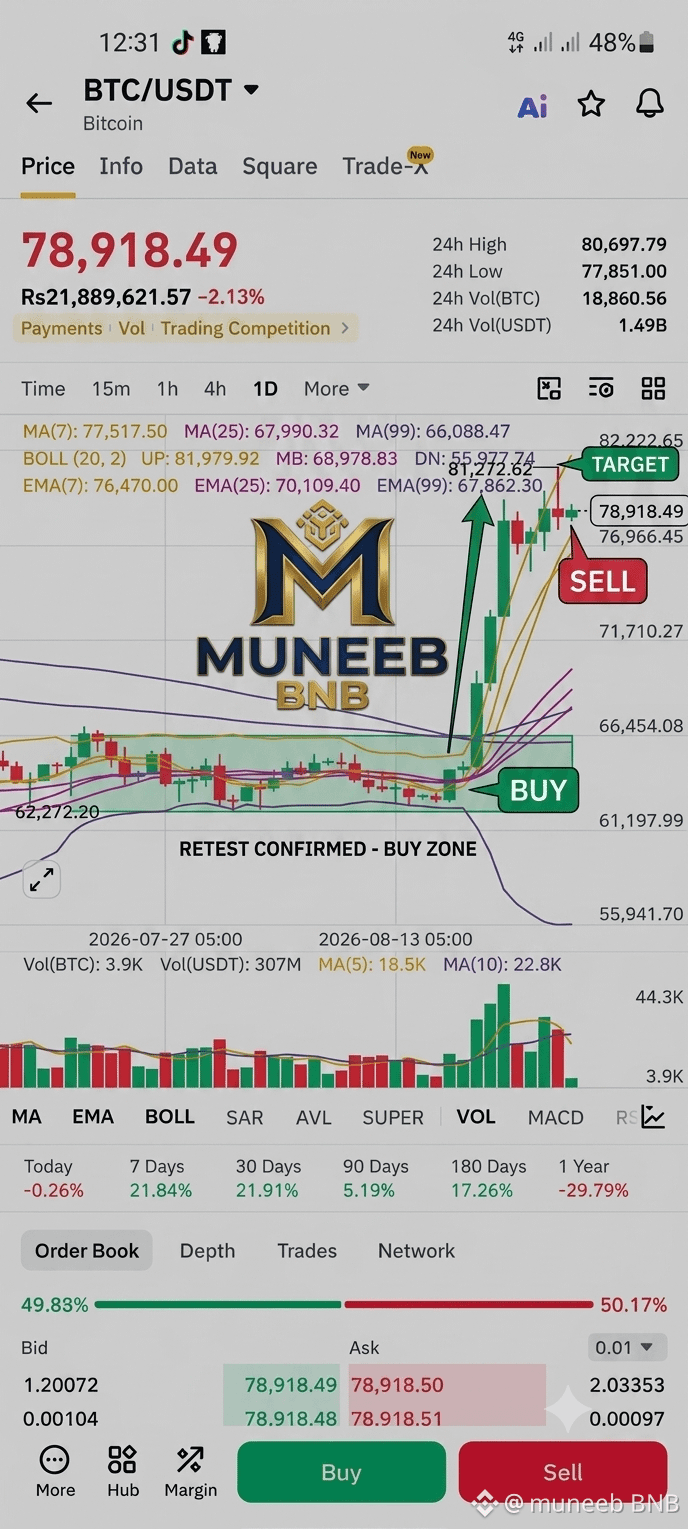
Technical Analysis (BTC/USDT 1D Chart)
Current Price & Structure: BTC is trading at $78,918.49, pulling back slightly (-2.13%) after tapping a high of $81,272.62. The price is consolidating just above the 7-day EMA ($76,470), maintaining a strong bullish bias.
Moving Averages & Bollinger Bands: The price recently exploded above all major moving averages—MA(7) at $77,517.50, MA(25) at $67,990.32, and MA(99) at $66,089.47. It hit upper resistance at the top Bollinger Band ($81,979.52).
Volume: Trading volume expanded significantly during the breakout from $62k, but is now cooling off, signaling consolidation rather than a complete reversal.
Key Support: $76,000 – $77,500 (MA 7 & EMA 7 zone). Below that lies major support near $71,710.
Key Resistance: $81,270 – $82,200 (Local High & Upper Bollinger Band).
Realistic Price Predictions
Short-Term (1–7 Days): $76,000 – $82,500
Expect a healthy retest of the $76,000–$77,500 demand zone. Hold this, and BTC will attempt another retest of $81,200–$82,500.
Mid-Term (2–4 Weeks): $85,000 – $92,000
As long as BTC holds above the $70,100 EMA(25) level, the trend remains macro-bullish, positioning the market for an expansion toward $85k–$90k+.
Binance Square Post Copy (Ready to Share)
🚀 BTC Daily Chart: Pullback Before the Next Leg Up? 🚨
Bitcoin is currently trading around $78,900 after sweeping liquidity up to $81,272! 📈
Key levels on the 1D chart:
🔹 Support: $76,000 - $77,500 (7-EMA holding strong)
🔹 Resistance: $81,200 - $82,200 (Upper Bollinger)
💡 Game Plan:
Short-Term Target: Retest $82,500 if $76k holds as support.
Mid-Term Target: $85,000 - $90,000+ once consolidation completes.
Are you buying this dip or waiting for $76k retest? 👇 Drop your trades below!
$BTC
#OpenAIReportedlyCompletesBelModelPretraining #USIranReportedlyReachCeasefireConsensus #USTreasuryLaunchesQuantumReadinessWorkingGroup #USCryptoEquityIndexRises5.04% #CanadaImposesUpTo50%CounterTariffsOnUSGoods
Current Price & Structure: BTC is trading at $78,918.49, pulling back slightly (-2.13%) after tapping a high of $81,272.62. The price is consolidating just above the 7-day EMA ($76,470), maintaining a strong bullish bias.
Moving Averages & Bollinger Bands: The price recently exploded above all major moving averages—MA(7) at $77,517.50, MA(25) at $67,990.32, and MA(99) at $66,089.47. It hit upper resistance at the top Bollinger Band ($81,979.52).
Volume: Trading volume expanded significantly during the breakout from $62k, but is now cooling off, signaling consolidation rather than a complete reversal.
Key Support: $76,000 – $77,500 (MA 7 & EMA 7 zone). Below that lies major support near $71,710.
Key Resistance: $81,270 – $82,200 (Local High & Upper Bollinger Band).
Realistic Price Predictions
Short-Term (1–7 Days): $76,000 – $82,500
Expect a healthy retest of the $76,000–$77,500 demand zone. Hold this, and BTC will attempt another retest of $81,200–$82,500.
Mid-Term (2–4 Weeks): $85,000 – $92,000
As long as BTC holds above the $70,100 EMA(25) level, the trend remains macro-bullish, positioning the market for an expansion toward $85k–$90k+.
Binance Square Post Copy (Ready to Share)
🚀 BTC Daily Chart: Pullback Before the Next Leg Up? 🚨
Bitcoin is currently trading around $78,900 after sweeping liquidity up to $81,272! 📈
Key levels on the 1D chart:
🔹 Support: $76,000 - $77,500 (7-EMA holding strong)
🔹 Resistance: $81,200 - $82,200 (Upper Bollinger)
💡 Game Plan:
Short-Term Target: Retest $82,500 if $76k holds as support.
Mid-Term Target: $85,000 - $90,000+ once consolidation completes.
Are you buying this dip or waiting for $76k retest? 👇 Drop your trades below!
$BTC
#OpenAIReportedlyCompletesBelModelPretraining #USIranReportedlyReachCeasefireConsensus #USTreasuryLaunchesQuantumReadinessWorkingGroup #USCryptoEquityIndexRises5.04% #CanadaImposesUpTo50%CounterTariffsOnUSGoods