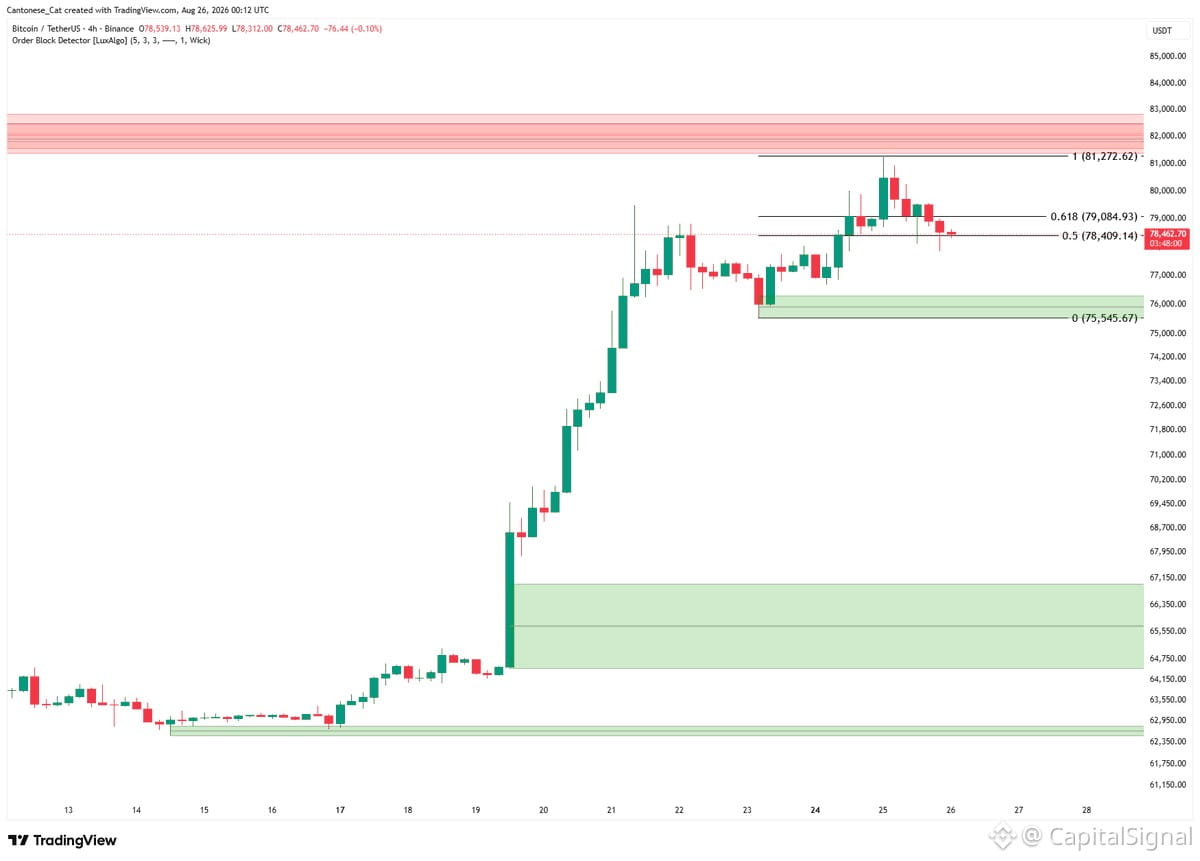
Looking at the $BTC 4-hour chart – looks like we just completed a clean 5-wave impulse move higher. Now we're in correction mode, cooling off after that big push up.
This is textbook Elliott Wave behavior. After a strong impulse, you typically see a corrective pullback before the next leg. The question now is how deep this correction goes and where support holds.
Watch for ABC correction patterns and key retracement levels. If this is just healthy consolidation after the impulse, we could see another leg up once the correction completes. But if support breaks, we might be looking at a larger corrective structure.
For traders: Let it breathe. Don't chase the correction. Wait for structure to complete and look for re-entry on confirmation of the next impulse wave.
This is textbook Elliott Wave behavior. After a strong impulse, you typically see a corrective pullback before the next leg. The question now is how deep this correction goes and where support holds.
Watch for ABC correction patterns and key retracement levels. If this is just healthy consolidation after the impulse, we could see another leg up once the correction completes. But if support breaks, we might be looking at a larger corrective structure.
For traders: Let it breathe. Don't chase the correction. Wait for structure to complete and look for re-entry on confirmation of the next impulse wave.